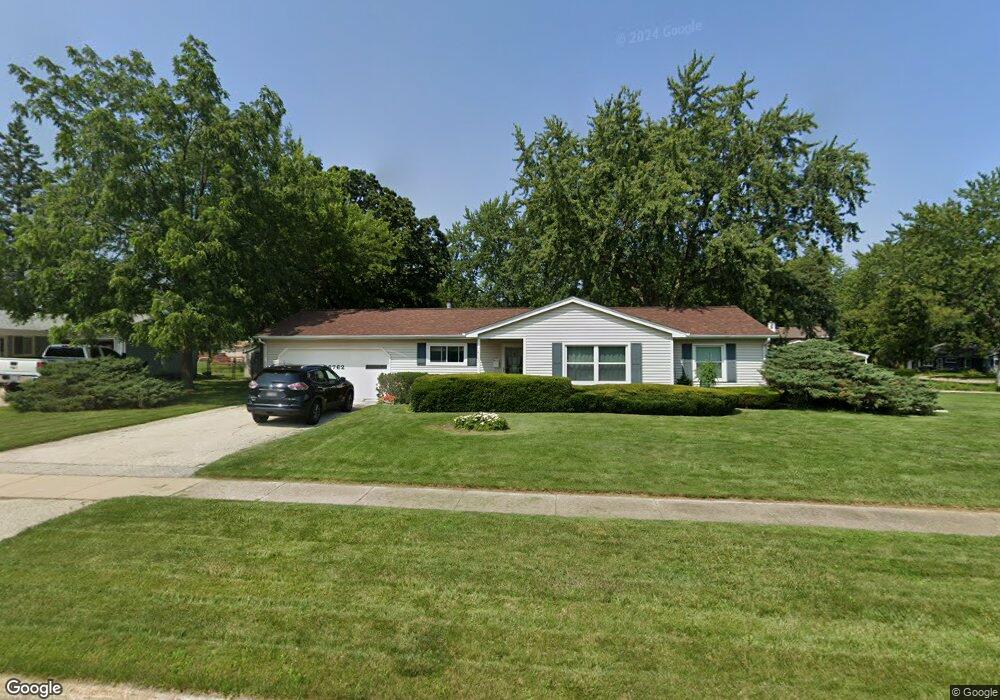
36762 N Traer Terrace Gurnee, IL 60031
Estimated Value: $286,081 - $308,000
--
Bed
2
Baths
1,311
Sq Ft
$225/Sq Ft
Est. Value
About This Home
This home is located at 36762 N Traer Terrace, Gurnee, IL 60031 and is currently estimated at $295,520, approximately $225 per square foot. 36762 N Traer Terrace is a home located in Lake County with nearby schools including Woodland Primary School, Woodland Intermediate School, and Woodland Elementary School.
Ownership History
Date
Name
Owned For
Owner Type
Purchase Details
Closed on
Nov 20, 1997
Sold by
Grand Premier Trust & Investment Inc Na
Bought by
Peters Robert C and Peters Tammy L
Current Estimated Value
Home Financials for this Owner
Home Financials are based on the most recent Mortgage that was taken out on this home.
Original Mortgage
$117,996
Outstanding Balance
$19,433
Interest Rate
7.32%
Mortgage Type
FHA
Estimated Equity
$276,087
Purchase Details
Closed on
Sep 23, 1994
Sold by
Costopoulos Gus
Bought by
Grand National Bank
Home Financials for this Owner
Home Financials are based on the most recent Mortgage that was taken out on this home.
Original Mortgage
$106,000
Interest Rate
8.6%
Purchase Details
Closed on
Mar 10, 1992
Sold by
Kathy Costopoulos Gus and Kathy Costopolous
Bought by
American National Bk & Tr Co Of Waukegan
Create a Home Valuation Report for This Property
The Home Valuation Report is an in-depth analysis detailing your home's value as well as a comparison with similar homes in the area
Home Values in the Area
Average Home Value in this Area
Purchase History
| Date | Buyer | Sale Price | Title Company |
|---|---|---|---|
| Peters Robert C | $121,500 | -- | |
| Grand National Bank | -- | -- | |
| Costopoulos Gus | -- | Ticor Title Insurance Compan | |
| American National Bk & Tr Co Of Waukegan | -- | Ticor Title Insurance Compan |
Source: Public Records
Mortgage History
| Date | Status | Borrower | Loan Amount |
|---|---|---|---|
| Open | Peters Robert C | $117,996 | |
| Previous Owner | Costopoulos Gus | $106,000 |
Source: Public Records
Tax History Compared to Growth
Tax History
| Year | Tax Paid | Tax Assessment Tax Assessment Total Assessment is a certain percentage of the fair market value that is determined by local assessors to be the total taxable value of land and additions on the property. | Land | Improvement |
|---|---|---|---|---|
| 2024 | $7,589 | $91,161 | $15,215 | $75,946 |
| 2023 | $7,155 | $82,171 | $13,715 | $68,456 |
| 2022 | $7,155 | $72,461 | $14,267 | $58,194 |
| 2021 | $6,241 | $66,879 | $13,168 | $53,711 |
| 2020 | $6,010 | $65,235 | $12,844 | $52,391 |
| 2019 | $5,891 | $63,341 | $12,471 | $50,870 |
| 2018 | $4,982 | $55,631 | $16,999 | $38,632 |
| 2017 | $4,983 | $54,037 | $16,512 | $37,525 |
| 2016 | $4,944 | $51,631 | $15,777 | $35,854 |
| 2015 | $4,775 | $48,967 | $14,963 | $34,004 |
| 2014 | $4,211 | $45,140 | $15,668 | $29,472 |
| 2012 | $4,473 | $45,486 | $15,788 | $29,698 |
Source: Public Records
Map
Nearby Homes
- 36712 N Traer Terrace
- 18595 W Judy Dr
- 18229 W Banbury Dr
- 18325 W Lakeview Terrace
- 18758 W Highfield Dr
- 36688 N Yew Tree Dr
- 36873 N Deer Trail Dr
- 18705 W Ash Dr
- 17925 W Stearns School Rd
- 17876 W Braewick Rd
- 17781 W Elsbury St
- 17820 W Braewick Rd
- 36259 N Field View Dr
- 17775 W Braewick Rd
- 36225 N Us Highway 45
- 1603 Napa Dr
- 1593 Vineyard Dr
- 36217 N Old Creek Ct
- 1601 Newgate Ct
- Abbeyville Plan at Briargate
- 36668 N Streamwood Dr
- 36746 N Traer Terrace
- 36674 N Streamwood Dr
- 36749 N Traer Terrace
- 36736 N Traer Terrace
- 37299 N Grandwood Dr
- 37315 N Grandwood Dr
- 36643 N Streamwood Dr
- 36625 N Streamwood Dr Unit 4
- 37287 N Grandwood Dr
- 36647 N Streamwood Dr
- 36612 N Streamwood Dr
- 36615 N Streamwood Dr
- 36733 N Traer Terrace
- 36724 N Traer Terrace
- 36692 N Streamwood Dr
- 36651 N Streamwood Dr
- 36607 N Streamwood Dr
- 37275 N Grandwood Dr
- 36721 N Traer Terrace