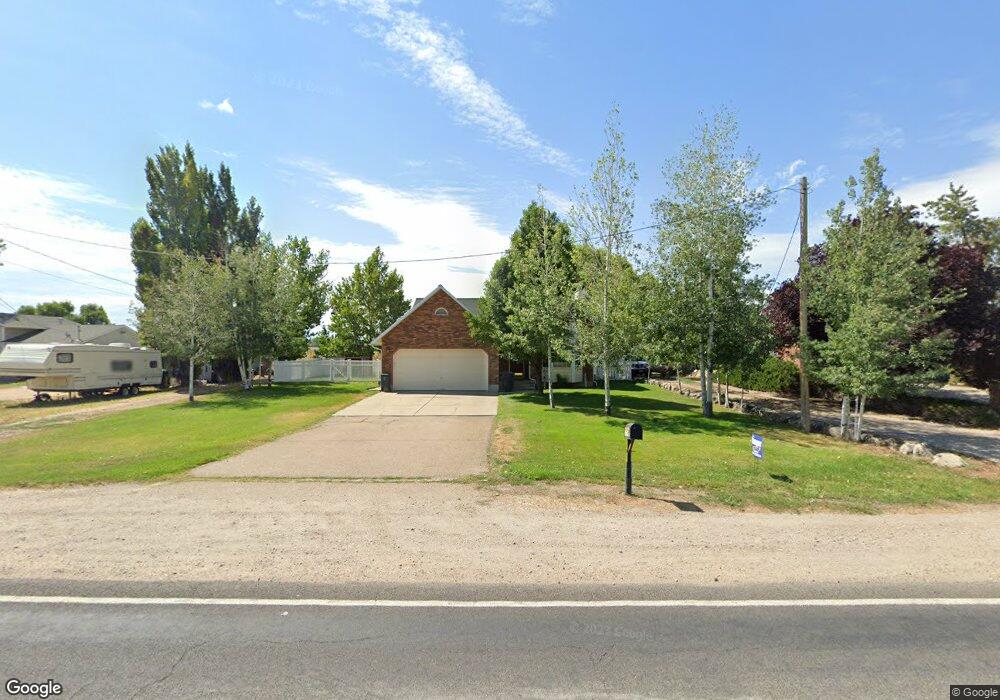
3677 W 1800 N Clearfield, UT 84015
Estimated Value: $554,000 - $682,000
5
Beds
3
Baths
2,206
Sq Ft
$273/Sq Ft
Est. Value
About This Home
This home is located at 3677 W 1800 N, Clearfield, UT 84015 and is currently estimated at $603,022, approximately $273 per square foot. 3677 W 1800 N is a home located in Davis County with nearby schools including West Point School, West Point Junior High School, and Syracuse High School.
Ownership History
Date
Name
Owned For
Owner Type
Purchase Details
Closed on
Jan 7, 2011
Sold by
Day Billy A and Day Michelle L
Bought by
Day Michelle L and Day Billy A
Current Estimated Value
Home Financials for this Owner
Home Financials are based on the most recent Mortgage that was taken out on this home.
Original Mortgage
$220,500
Outstanding Balance
$147,229
Interest Rate
4.43%
Mortgage Type
VA
Estimated Equity
$455,793
Purchase Details
Closed on
Oct 9, 1997
Sold by
Otto James R
Bought by
Day Billy A and Day Michelle L
Home Financials for this Owner
Home Financials are based on the most recent Mortgage that was taken out on this home.
Original Mortgage
$127,800
Interest Rate
7.49%
Purchase Details
Closed on
Oct 6, 1997
Sold by
Otto Leah M
Bought by
Day Billy A and Day Michelle L
Home Financials for this Owner
Home Financials are based on the most recent Mortgage that was taken out on this home.
Original Mortgage
$127,800
Interest Rate
7.49%
Create a Home Valuation Report for This Property
The Home Valuation Report is an in-depth analysis detailing your home's value as well as a comparison with similar homes in the area
Home Values in the Area
Average Home Value in this Area
Purchase History
| Date | Buyer | Sale Price | Title Company |
|---|---|---|---|
| Day Michelle L | -- | Bonneville Superior Title Co | |
| Day Billy A | -- | Avis & Archibald Title Insur | |
| Day Billy A | -- | Avis & Archibald Title Insur |
Source: Public Records
Mortgage History
| Date | Status | Borrower | Loan Amount |
|---|---|---|---|
| Open | Day Michelle L | $220,500 | |
| Closed | Day Billy A | $127,800 |
Source: Public Records
Tax History
| Year | Tax Paid | Tax Assessment Tax Assessment Total Assessment is a certain percentage of the fair market value that is determined by local assessors to be the total taxable value of land and additions on the property. | Land | Improvement |
|---|---|---|---|---|
| 2025 | $709 | $314,242 | $181,433 | $132,809 |
| 2024 | $847 | $275,550 | $197,615 | $77,935 |
| 2023 | $1,435 | $260,150 | $153,908 | $106,241 |
| 2022 | $1,710 | $495,000 | $280,717 | $214,283 |
| 2021 | $1,071 | $363,000 | $206,447 | $156,553 |
| 2020 | $721 | $317,000 | $174,861 | $142,139 |
| 2019 | $744 | $309,000 | $175,203 | $133,797 |
| 2018 | $523 | $277,000 | $158,158 | $118,842 |
| 2016 | $429 | $139,831 | $72,900 | $66,931 |
| 2015 | $1,886 | $127,841 | $72,900 | $54,941 |
| 2014 | $403 | $140,218 | $69,853 | $70,365 |
| 2013 | -- | $111,759 | $61,319 | $50,440 |
Source: Public Records
Map
Nearby Homes
- 3656 W 1800 N
- 2118 Snowy Crane Dr
- 2000 Garden Plan at Cranefield Estates - Collection
- 2400 Garden Plan at Cranefield Estates - Collection
- 2500 Farmhouse Plan at Cranefield Estates - Collection
- 1700 Farmhouse Plan at Cranefield Estates - Collection
- San Marino Traditional Plan at Cranefield Estates
- 3816 W 2300 N
- 3828 W 2300 N
- 3826 W 2350 N
- 4348 W 1825 N Unit 103
- 339 N 3250 W Unit 12
- 3941 W 1800 N
- 4382 W 1825 N Unit 110
- 2444 N Hooded Crane Cir Unit 11
- 4396 W 1825 N Unit 112
- 2927 W 2100 N
- 2084 N 4500 W
- 2542 N 3300 W
- 3144 W 1050 N
- 3693 W 1800 N
- 3655 W 1800 N
- 3717 W 1800 N
- 1823 N 3675 W
- 1823 N 3675 W Unit 1
- 1822 N 3675 W
- 3611 W 1800 N
- 1845 N 3675 W
- 1844 N 3675 W
- 3763 W 1800 N
- 3589 W 1800 N
- 1867 N 3675 W
- 3656 W 1800 N Unit 20
- 3756 W 1800 N
- 1868 N 3675 W
- 3638 W 1800 N
- 3638 W 1800 N Unit 21
- 1871 N 3675 W
- 1880 N 3675 W
- 3788 W 1800 N
Your Personal Tour Guide
Ask me questions while you tour the home.