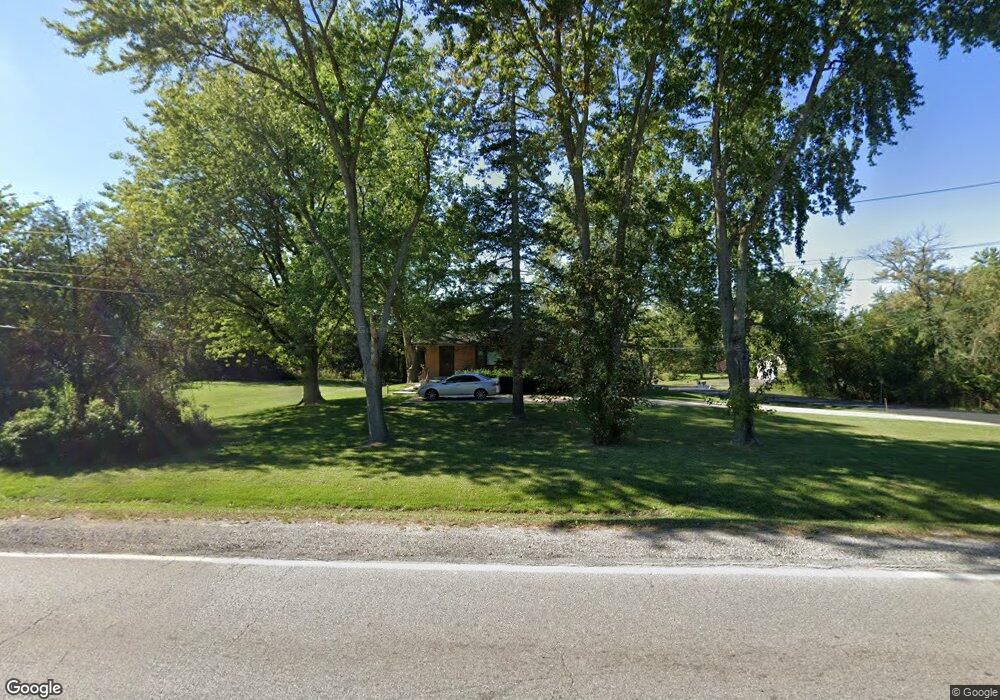
36796 N Green Bay Rd Waukegan, IL 60087
Estimated Value: $202,000 - $242,000
3
Beds
1
Bath
1,200
Sq Ft
$182/Sq Ft
Est. Value
About This Home
This home is located at 36796 N Green Bay Rd, Waukegan, IL 60087 and is currently estimated at $217,969, approximately $181 per square foot. 36796 N Green Bay Rd is a home located in Lake County with nearby schools including Oakdale Elementary School, Jack Benny Middle School, and Waukegan High School.
Ownership History
Date
Name
Owned For
Owner Type
Purchase Details
Closed on
Jan 20, 2024
Sold by
Conde Linda
Bought by
Argent Ventures Series Llc Series E
Current Estimated Value
Purchase Details
Closed on
Aug 4, 2008
Sold by
Washington Mutual Bank
Bought by
Conde Linda
Purchase Details
Closed on
Jun 30, 2008
Sold by
Jorrin
Bought by
Washington Mutual Bank
Purchase Details
Closed on
May 25, 2000
Sold by
Tonkin Donald D and Tonkin Roberta L
Bought by
Jorrin Elena M
Home Financials for this Owner
Home Financials are based on the most recent Mortgage that was taken out on this home.
Original Mortgage
$94,500
Interest Rate
8.21%
Purchase Details
Closed on
Apr 3, 1996
Sold by
Tonkin Dorothy A and Tonkin Donald D
Bought by
Tonkin Dorothy A
Purchase Details
Closed on
Jan 18, 1996
Sold by
Tonkin Dorothy
Bought by
Tonkin Dorothy and Tonkin Donald D
Create a Home Valuation Report for This Property
The Home Valuation Report is an in-depth analysis detailing your home's value as well as a comparison with similar homes in the area
Home Values in the Area
Average Home Value in this Area
Purchase History
| Date | Buyer | Sale Price | Title Company |
|---|---|---|---|
| Argent Ventures Series Llc Series E | -- | None Listed On Document | |
| Conde Linda | $85,000 | World Title Guaranty Inc | |
| Washington Mutual Bank | -- | None Available | |
| Jorrin Elena M | -- | -- | |
| Tonkin Dorothy A | -- | -- | |
| Tonkin Dorothy | -- | -- |
Source: Public Records
Mortgage History
| Date | Status | Borrower | Loan Amount |
|---|---|---|---|
| Previous Owner | Jorrin Elena M | $94,500 |
Source: Public Records
Tax History Compared to Growth
Tax History
| Year | Tax Paid | Tax Assessment Tax Assessment Total Assessment is a certain percentage of the fair market value that is determined by local assessors to be the total taxable value of land and additions on the property. | Land | Improvement |
|---|---|---|---|---|
| 2024 | $3,427 | $56,298 | $9,111 | $47,187 |
| 2023 | $3,583 | $50,568 | $8,012 | $42,556 |
| 2022 | $3,583 | $47,638 | $8,282 | $39,356 |
| 2021 | $3,848 | $48,282 | $7,865 | $40,417 |
| 2020 | $3,888 | $44,980 | $7,327 | $37,653 |
| 2019 | $3,980 | $41,217 | $6,714 | $34,503 |
| 2018 | $4,218 | $42,388 | $7,602 | $34,786 |
| 2017 | $4,171 | $37,502 | $6,726 | $30,776 |
| 2016 | $4,014 | $32,588 | $5,845 | $26,743 |
| 2015 | $3,912 | $29,166 | $5,231 | $23,935 |
| 2014 | $2,390 | $17,968 | $3,867 | $14,101 |
| 2012 | $3,088 | $19,466 | $4,189 | $15,277 |
Source: Public Records
Map
Nearby Homes
- 36245 N Green Bay Rd
- 12535 W Blanchard Rd
- 3032 W Vermont Ave
- 36955 N Garrick Ave
- 3320 Sunset Ave
- 13360 W Blanchard Rd
- 12933 W Polo Ave
- 3436 Florida Ave
- 2928 W Country Club Ave
- 3000 W Country Club Ave
- 2946 W Country Club Ave
- 12312 W Audrey Ave
- 2713 Varonen Ave
- 2708 Dana Ave
- 2705 Dana Ave
- 2345 N Mcaree Rd
- 2715 W Greenwood Ave
- 3627 Atlantic Ave
- 0 Ryan Rd
- 2670 Woodview Ct Unit 1
- 36768 N Green Bay Rd
- 12934 W Nemesis Ave
- 36793 N Green Bay Rd
- 36781 N Green Bay Rd
- 36833 N Green Bay Rd
- 36864 N Green Bay Rd
- 36741 N Green Bay Rd
- 12831 W Nemesis Ave
- 12963 W Wall Ave
- 12838 W Vermont Ave
- 12861 W Vermont Ave
- 36705 N Green Bay Rd
- 12985 W Wall Ave
- 12843 W Vermont Ave
- 12934 W Wall Ave
- 36693 N Green Bay Rd
- 2324 N Green Bay Rd
- 12812 W Vermont Ave
- 12831 W Vermont Ave
- 12962 W Wall Ave