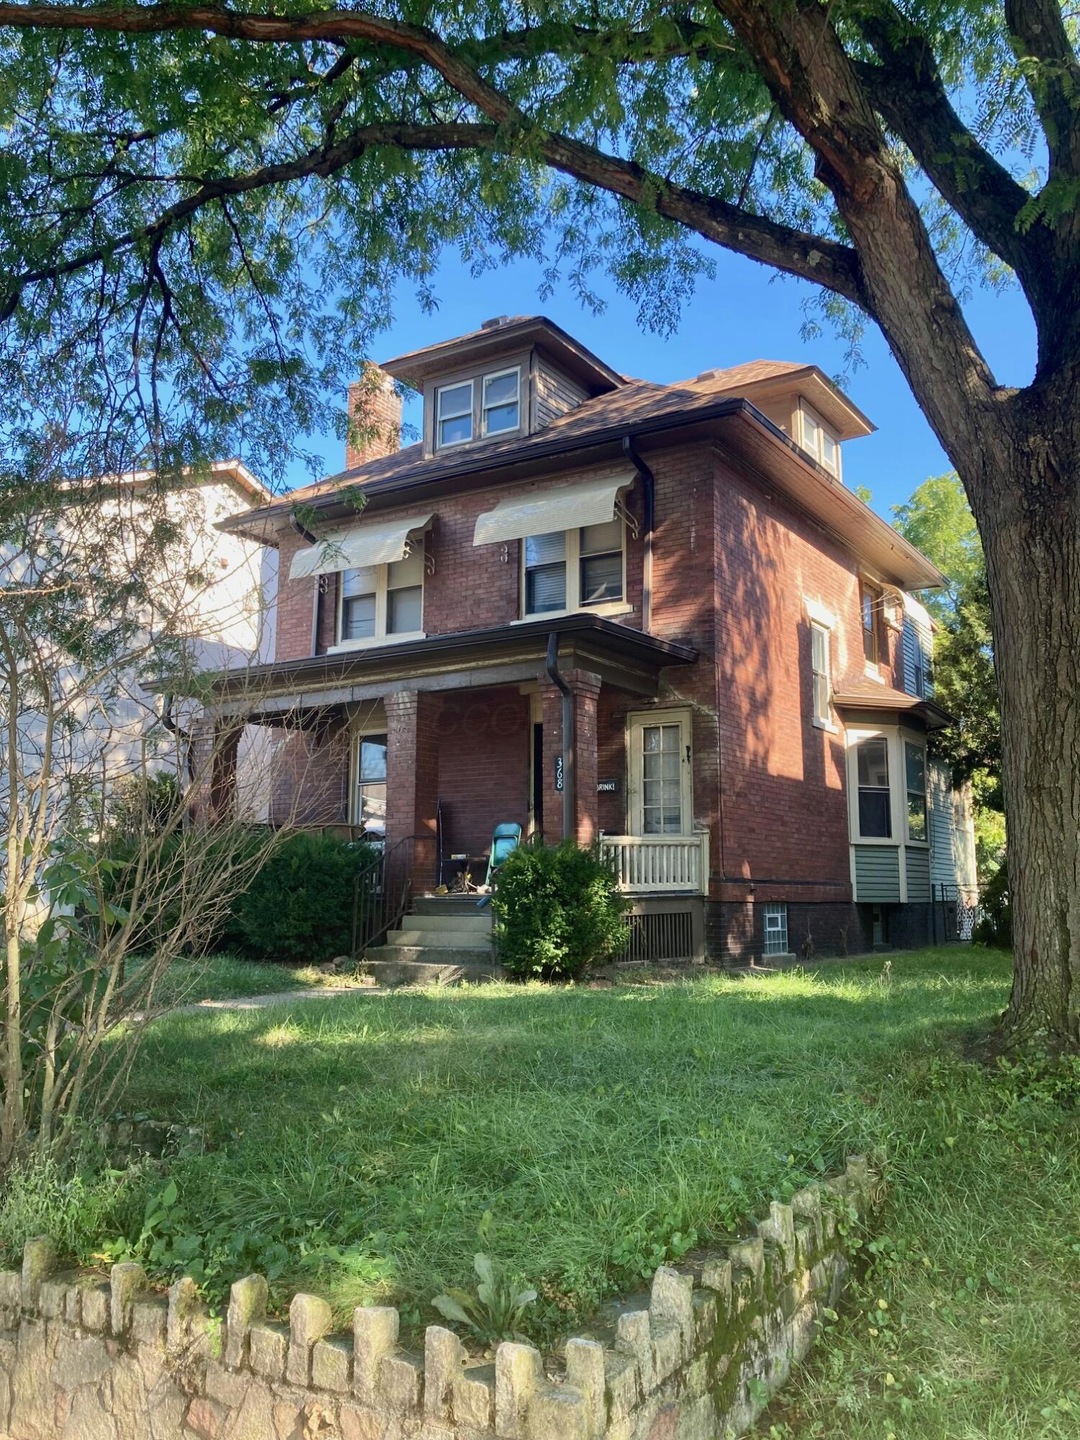
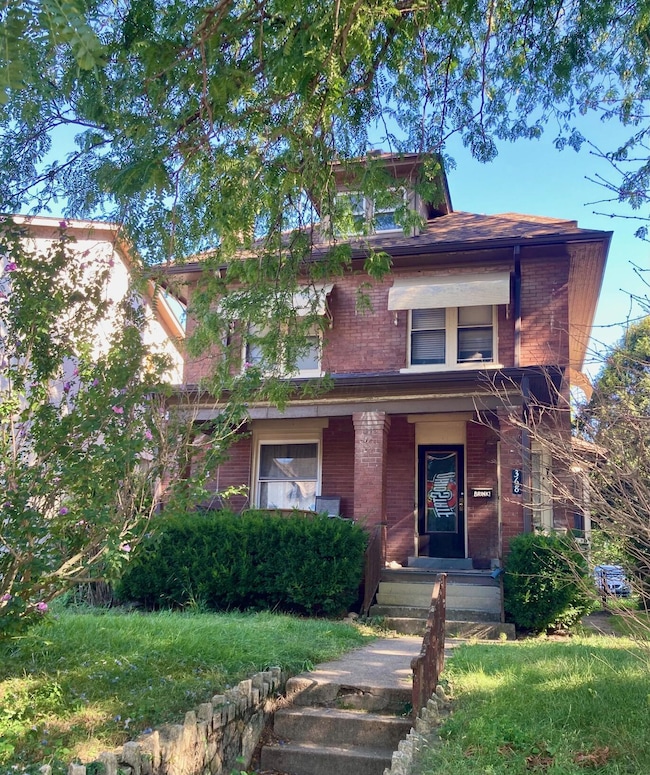
368 Alden Ave Unit 368 Columbus, OH 43201
Old North Columbus NeighborhoodEstimated payment $2,302/month
Highlights
- Multiple Fireplaces
- Wood Flooring
- Forced Air Heating and Cooling System
- Traditional Architecture
- No HOA
- 4-minute walk to Maynard & Summit Park
About This Home
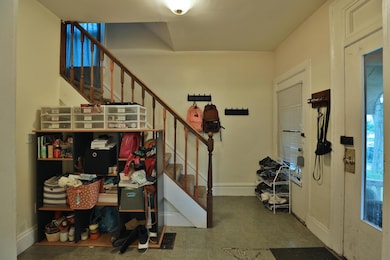
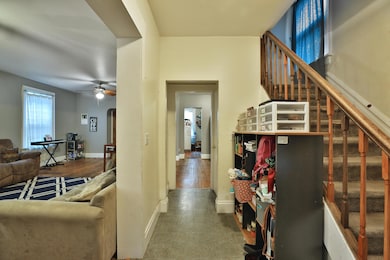
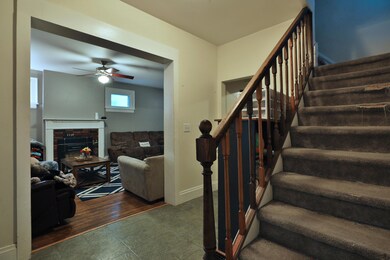
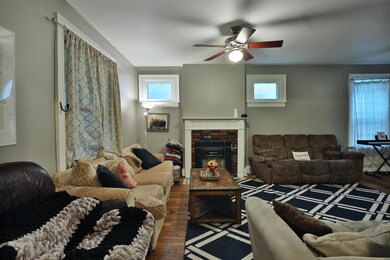
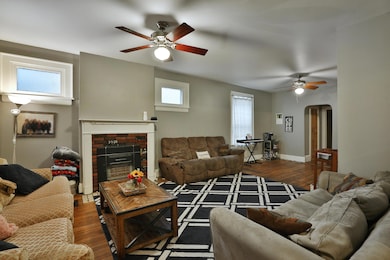
Back on market! Impressive, well maintained brick and wood 5 bedroom 2 full bath home situated in ideal location. This property has all the elements the savvy investor looks for when considering an investment with superb rent potential! Low maintenance brick front with wood at the rear. Spacious front porch provides plenty of space to relax outdoors as well as rear yard space. Enter into the large open foyer which accommodates space for coats, backpacks, shoes, or more. Open expanded living room with decorative fireplace, hardwood floors. Walls have been removed to make even more open space. Dining room area has hardwood floors and bay window area. Rare first floor full bath. Second floor has four bedrooms and updated full bath. Beautifully finished third floor adds over 200 square feet of additional bedroom space and enormous closet. Many replacement windows installed. Huge usable basement with two HVAC systems, one just installed 9/2025 and the other one in 2019. Glass block windows allow for well lit, bright basement. Newer sewer line. Newer roof (2018). New gutters with gutter guards (2022). Parking lot behind the house can hold eight cars and on street parking in front available. Property has been consistently rented for years with no vacancy, but open now for new tenants. Don't miss out on this rare opportunity!

Home Details
Home Type
- Single Family
Est. Annual Taxes
- $5,493
Year Built
- Built in 1906
Lot Details
- 5,663 Sq Ft Lot
Home Design
- Traditional Architecture
- Brick Exterior Construction
- Block Foundation
- Stone Foundation
- Wood Siding
Interior Spaces
- 2,020 Sq Ft Home
- 2.5-Story Property
- Multiple Fireplaces
- Decorative Fireplace
- Insulated Windows
- Laundry on lower level
- Basement
Kitchen
- Electric Range
- Dishwasher
Flooring
- Wood
- Carpet
Bedrooms and Bathrooms
- 5 Bedrooms
Parking
- On-Street Parking
- Off-Street Parking: 8
Utilities
- Forced Air Heating and Cooling System
- Heating System Uses Gas
- Gas Water Heater
Community Details
- No Home Owners Association
Listing and Financial Details
- Assessor Parcel Number 010-054837
Map
Home Values in the Area
Average Home Value in this Area
Tax History
| Year | Tax Paid | Tax Assessment Tax Assessment Total Assessment is a certain percentage of the fair market value that is determined by local assessors to be the total taxable value of land and additions on the property. | Land | Improvement |
|---|---|---|---|---|
| 2024 | $5,493 | $119,850 | $36,300 | $83,550 |
| 2023 | $5,424 | $119,840 | $36,295 | $83,545 |
| 2022 | $4,186 | $78,760 | $22,930 | $55,830 |
| 2021 | $4,193 | $78,760 | $22,930 | $55,830 |
| 2020 | $4,199 | $78,760 | $22,930 | $55,830 |
| 2019 | $3,917 | $63,000 | $18,340 | $44,660 |
| 2018 | $3,409 | $63,000 | $18,340 | $44,660 |
| 2017 | $3,917 | $63,000 | $18,340 | $44,660 |
| 2016 | $3,194 | $47,010 | $8,440 | $38,570 |
| 2015 | $2,908 | $47,010 | $8,440 | $38,570 |
| 2014 | $2,915 | $47,010 | $8,440 | $38,570 |
| 2013 | $1,307 | $42,735 | $7,665 | $35,070 |
Property History
| Date | Event | Price | List to Sale | Price per Sq Ft |
|---|---|---|---|---|
| 07/21/2025 07/21/25 | Price Changed | $349,900 | -1.4% | $173 / Sq Ft |
| 06/23/2025 06/23/25 | Price Changed | $354,900 | -1.4% | $176 / Sq Ft |
| 06/02/2025 06/02/25 | For Sale | $359,900 | -- | $178 / Sq Ft |
Purchase History
| Date | Type | Sale Price | Title Company |
|---|---|---|---|
| Warranty Deed | $162,500 | None Available | |
| Warranty Deed | $111,400 | Title First Agency Inc | |
| Deed | $43,500 | -- | |
| Deed | -- | -- | |
| Deed | $38,500 | -- |
Mortgage History
| Date | Status | Loan Amount | Loan Type |
|---|---|---|---|
| Previous Owner | $105,800 | Purchase Money Mortgage |
Source: Columbus and Central Ohio Regional MLS
MLS Number: 225019471
APN: 010-054837
Disclaimer: Certain information contained herein is derived from information provided by parties other than Homes.com. All information provided is deemed reliable, but is not guaranteed to be accurate and should be independently verified.
![]() IDX information is provided exclusively for personal, non-commercial use, and may not be used for any purpose other than to identify prospective properties consumers may be interested in purchasing.
IDX information is provided exclusively for personal, non-commercial use, and may not be used for any purpose other than to identify prospective properties consumers may be interested in purchasing.
Information is deemed reliable but not guaranteed.
- 381 E Oakland Ave
- 377 Alden Ave
- 2230 N 4th St
- 2251 Indiana Ave
- 2293 N 4th St
- 2295 N 4th St
- 2103 Iuka Ave
- 328 Wyandotte Ave Unit 326
- 261 E Northwood Ave Unit 40
- 497 E Oakland Ave
- 2127 Indiana Ave
- 2083 N 4th St
- 2350 Indiana Ave
- 217 E Oakland Ave
- 223 E Patterson Ave
- 2045 N 4th St
- 2397 Glenmawr Ave Unit 399
- 2395 Summit St Unit 397
- 223-225 E Maynard Ave
- 241 E Blake Ave
- 2136 Summit St
- 2158 Indiana Ave
- 2266 Indiana Ave
- 464 E Oakland Ave
- 2137 Indiana Ave
- 477 Wyandotte Ave Unit 475
- 2090 N 4th St
- 2086 N 4th St
- 464 E Norwich Ave
- 474 1/2 E Norwich Ave Unit B
- 474 1/2 E Norwich Ave Unit E
- 474 E Norwich Ave Unit A
- 474 E Norwich Ave
- 2398 Indiana Ave
- 223 E Maynard Ave
- 161 E Oakland Ave
- 2417 Summit St Unit B
- 305-307-307 E 19th Ave Unit 305
- 305-307-307 E 19th Ave Unit 307
- 2444 Deming Ave