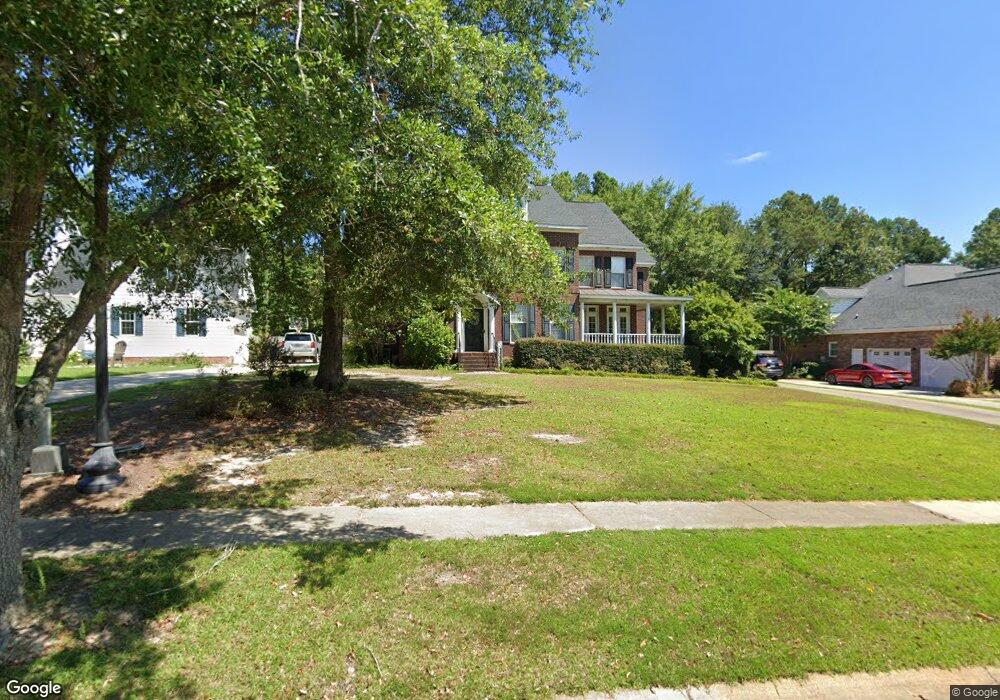
368 Bloomsbury Cir Camden, SC 29020
Estimated Value: $497,000 - $513,000
4
Beds
4
Baths
2,947
Sq Ft
$172/Sq Ft
Est. Value
About This Home
This home is located at 368 Bloomsbury Cir, Camden, SC 29020 and is currently estimated at $507,540, approximately $172 per square foot. 368 Bloomsbury Cir is a home located in Kershaw County with nearby schools including Pine Tree Hill Elementary School, Camden Middle School, and Camden High School.
Ownership History
Date
Name
Owned For
Owner Type
Purchase Details
Closed on
Nov 26, 2024
Sold by
Parker Andrew and Parker Jenna Faith
Bought by
Bader Addason and Bader Danielle
Current Estimated Value
Home Financials for this Owner
Home Financials are based on the most recent Mortgage that was taken out on this home.
Original Mortgage
$479,000
Outstanding Balance
$474,512
Interest Rate
6.44%
Mortgage Type
VA
Estimated Equity
$33,028
Purchase Details
Closed on
Jan 2, 2023
Sold by
Cochran Craig Cullen
Bought by
Parker Andrew and Parker Jenna Faith
Home Financials for this Owner
Home Financials are based on the most recent Mortgage that was taken out on this home.
Original Mortgage
$438,867
Interest Rate
6.42%
Purchase Details
Closed on
Jan 30, 2015
Sold by
Lackey Sandra S
Bought by
Cochran Craig Cullen
Purchase Details
Closed on
Mar 17, 2003
Sold by
Lackey Robert H and Lackey Virginia G
Bought by
Lackey Sandra S
Create a Home Valuation Report for This Property
The Home Valuation Report is an in-depth analysis detailing your home's value as well as a comparison with similar homes in the area
Home Values in the Area
Average Home Value in this Area
Purchase History
| Date | Buyer | Sale Price | Title Company |
|---|---|---|---|
| Bader Addason | $479,000 | None Listed On Document | |
| Bader Addason | $479,000 | None Listed On Document | |
| Parker Andrew | $429,000 | -- | |
| Cochran Craig Cullen | $232,000 | -- | |
| Lackey Sandra S | $235,000 | -- |
Source: Public Records
Mortgage History
| Date | Status | Borrower | Loan Amount |
|---|---|---|---|
| Open | Bader Addason | $479,000 | |
| Closed | Bader Addason | $479,000 | |
| Previous Owner | Parker Andrew | $438,867 |
Source: Public Records
Tax History Compared to Growth
Tax History
| Year | Tax Paid | Tax Assessment Tax Assessment Total Assessment is a certain percentage of the fair market value that is determined by local assessors to be the total taxable value of land and additions on the property. | Land | Improvement |
|---|---|---|---|---|
| 2025 | $3,045 | $479,000 | $70,000 | $409,000 |
| 2024 | $3,045 | $429,000 | $52,000 | $377,000 |
| 2023 | $1,605 | $429,000 | $52,000 | $377,000 |
| 2022 | $1,880 | $322,900 | $40,000 | $282,900 |
| 2021 | $1,678 | $308,400 | $40,000 | $268,400 |
| 2020 | $1,626 | $260,700 | $30,000 | $230,700 |
| 2019 | $1,680 | $260,700 | $30,000 | $230,700 |
| 2018 | $1,699 | $260,700 | $30,000 | $230,700 |
| 2017 | $1,591 | $260,700 | $30,000 | $230,700 |
| 2016 | $1,435 | $232,900 | $30,000 | $202,900 |
| 2015 | $1,183 | $232,900 | $30,000 | $202,900 |
| 2014 | $1,183 | $0 | $0 | $0 |
Source: Public Records
Map
Nearby Homes
- 22 Genesis Ln
- 2256 Tickle Hill Rd
- 97 Southern Oaks Dr
- 193 Southern Oak Dr
- 7 Pin Oak Ct
- 70 Rapid Run
- 134 Rapid Run
- 214 Bobwhite Cir Unit 15
- 605 Dove Rd Unit 63
- 207 York St
- 0 Lake Hermitage Development Site
- 906 Fair St
- 1205 Jefferson Davis Hwy
- 1116 Mathis Ct
- 1514 Lewis St
- 1301 Fair St
- 1313 Fair St
- 1317 Fair St
- 1305 Fair St
- 306 Hampton Park
- 372 Bloomsbury Cir
- 364 Bloomsbury Cir
- 374 Bloomsbury Cir
- 360 Bloomsbury Cir
- 369 Bloomsbury Cir
- 361 Bloomsbury Cir
- 378 Bloomsbury Cir
- 377 Bloomsbury Cir
- 356 Bloomsbury Cir
- 355 Bloomsbury Cir
- 383 Bloomsbury Cir
- 380 Bloomsbury Cir
- 505 Indigo Ct
- 384 Bloomsbury Cir
- 341 Bloomsbury Cir
- 607 Frogden Ct
- 507 Indigo Ct
- 387 Bloomsbury Cir
- 502 Indigo Ct
- 506 Indigo Ct