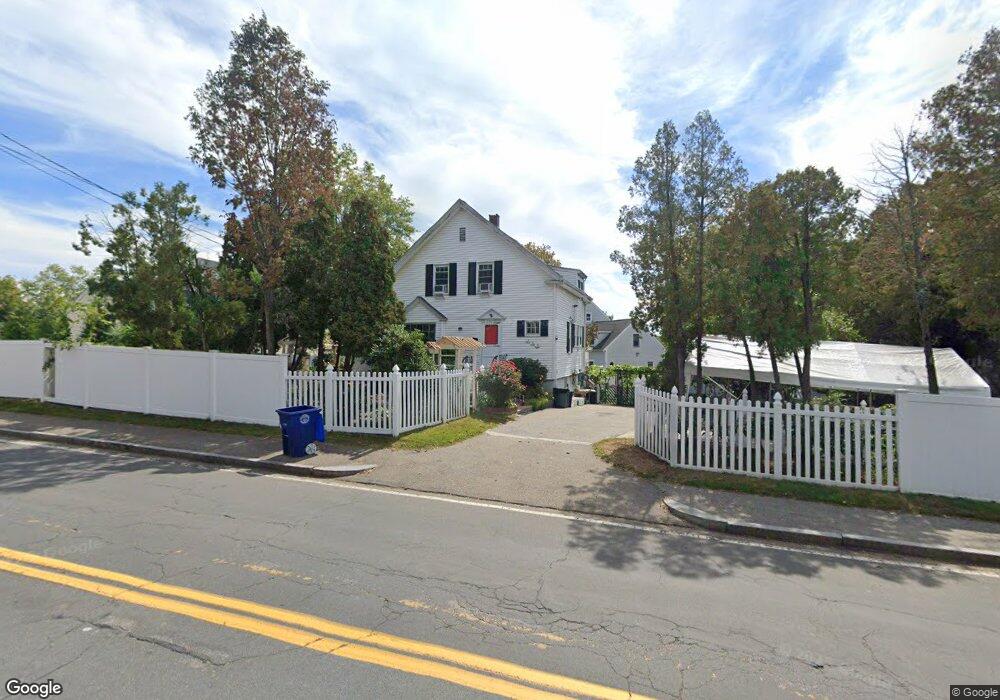
368 Common St Braintree, MA 02184
North Braintree NeighborhoodEstimated Value: $656,268 - $697,000
3
Beds
2
Baths
1,638
Sq Ft
$409/Sq Ft
Est. Value
About This Home
This home is located at 368 Common St, Braintree, MA 02184 and is currently estimated at $670,089, approximately $409 per square foot. 368 Common St is a home located in Norfolk County with nearby schools including Braintree High School, Step Ahead Kindergarten, and Meeting House Montessori School.
Create a Home Valuation Report for This Property
The Home Valuation Report is an in-depth analysis detailing your home's value as well as a comparison with similar homes in the area
Home Values in the Area
Average Home Value in this Area
Tax History
| Year | Tax Paid | Tax Assessment Tax Assessment Total Assessment is a certain percentage of the fair market value that is determined by local assessors to be the total taxable value of land and additions on the property. | Land | Improvement |
|---|---|---|---|---|
| 2025 | $5,180 | $519,000 | $273,500 | $245,500 |
| 2024 | $4,753 | $501,400 | $259,600 | $241,800 |
| 2023 | $4,486 | $459,600 | $231,800 | $227,800 |
| 2022 | $4,480 | $450,300 | $222,500 | $227,800 |
| 2021 | $4,064 | $408,400 | $194,700 | $213,700 |
| 2020 | $3,930 | $398,600 | $194,700 | $203,900 |
| 2019 | $3,799 | $376,500 | $185,400 | $191,100 |
| 2018 | $3,685 | $349,600 | $166,900 | $182,700 |
| 2017 | $3,435 | $319,800 | $148,300 | $171,500 |
| 2016 | $3,326 | $302,900 | $139,100 | $163,800 |
| 2015 | $3,221 | $291,000 | $133,500 | $157,500 |
| 2014 | $3,030 | $265,300 | $120,500 | $144,800 |
Source: Public Records
Map
Nearby Homes
- 20 Blossom Rd
- 87 Walnut St
- 63 Dickerman Ln
- 15 Calvin St
- 47 Addison St
- 21 Totman St Unit 205
- 21 Totman St Unit 409
- 21 Totman St Unit 203
- 21 Totman St Unit 403
- 21 Totman St Unit 301
- 21 Totman St Unit 208
- 21 Totman St Unit PH-405
- 21 Totman St Unit PH-401
- 21 Totman St Unit 407
- 21 Totman St Unit 204
- 51 Branch St Unit 2
- 51 Branch St Unit 3
- 7 Del's Way
- 260 West St Unit 7
- 87 Village Dr
Your Personal Tour Guide
Ask me questions while you tour the home.