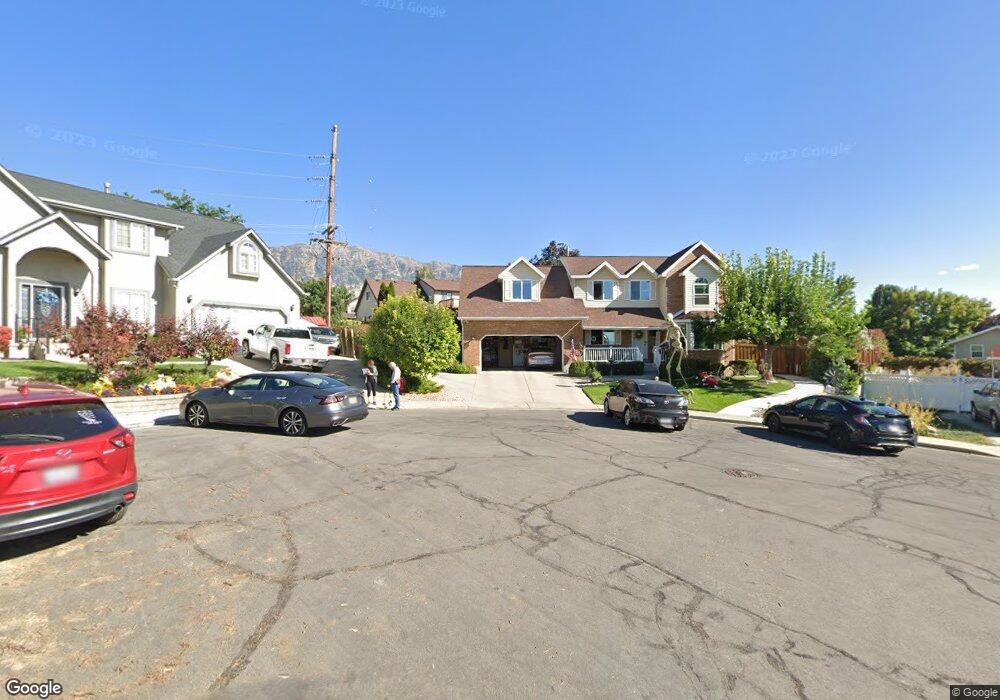
368 E 1950 N Orem, UT 84057
Northridge NeighborhoodEstimated Value: $615,000 - $668,000
3
Beds
4
Baths
2,280
Sq Ft
$281/Sq Ft
Est. Value
About This Home
This home is located at 368 E 1950 N, Orem, UT 84057 and is currently estimated at $640,455, approximately $280 per square foot. 368 E 1950 N is a home located in Utah County with nearby schools including Northridge Elementary School, Oak Canyon Junior High School, and Timpanogos High School.
Ownership History
Date
Name
Owned For
Owner Type
Purchase Details
Closed on
Jan 26, 2016
Sold by
Wilkinson Jeffrey A and Wilkinson Treasa A
Bought by
Wilkinson Jeff and Wilkinson Treasa
Current Estimated Value
Home Financials for this Owner
Home Financials are based on the most recent Mortgage that was taken out on this home.
Original Mortgage
$205,000
Outstanding Balance
$88,266
Interest Rate
3.94%
Mortgage Type
New Conventional
Estimated Equity
$552,189
Purchase Details
Closed on
Oct 1, 2001
Sold by
Running Richard A and Running Kimberley Marie
Bought by
Wilkinson Jeffery A and Wilkinson Treasa A
Home Financials for this Owner
Home Financials are based on the most recent Mortgage that was taken out on this home.
Original Mortgage
$176,800
Interest Rate
6.9%
Create a Home Valuation Report for This Property
The Home Valuation Report is an in-depth analysis detailing your home's value as well as a comparison with similar homes in the area
Home Values in the Area
Average Home Value in this Area
Purchase History
| Date | Buyer | Sale Price | Title Company |
|---|---|---|---|
| Wilkinson Jeff | -- | Keystone Title Ins Agency | |
| Wilkinson Jeffery A | -- | First American Title Insuran |
Source: Public Records
Mortgage History
| Date | Status | Borrower | Loan Amount |
|---|---|---|---|
| Open | Wilkinson Jeff | $205,000 | |
| Closed | Wilkinson Jeffery A | $176,800 |
Source: Public Records
Tax History
| Year | Tax Paid | Tax Assessment Tax Assessment Total Assessment is a certain percentage of the fair market value that is determined by local assessors to be the total taxable value of land and additions on the property. | Land | Improvement |
|---|---|---|---|---|
| 2025 | $2,670 | $351,835 | -- | -- |
| 2024 | $2,670 | $326,480 | $0 | $0 |
| 2023 | $2,520 | $331,155 | $0 | $0 |
| 2022 | $2,572 | $327,525 | $0 | $0 |
| 2021 | $2,300 | $443,600 | $170,100 | $273,500 |
| 2020 | $2,133 | $404,200 | $136,100 | $268,100 |
| 2019 | $1,873 | $369,200 | $136,100 | $233,100 |
| 2018 | $1,919 | $361,400 | $128,300 | $233,100 |
| 2017 | $1,758 | $177,375 | $0 | $0 |
| 2016 | $1,679 | $156,200 | $0 | $0 |
| 2015 | $1,761 | $154,935 | $0 | $0 |
| 2014 | $1,554 | $136,070 | $0 | $0 |
Source: Public Records
Map
Nearby Homes
- 110 S 1320 E
- 540 E Quail Rd
- 695 E 1870 N
- 1636 N 160 E
- 1638 N 160 E
- 14 N 850 E
- 1051 E 100 N
- 49 W 1880 N
- 1480 N 430 E
- 120 N 950 E
- 363 E 1395 N Unit 22
- 1643 N Mountain Oaks Dr
- 723 E 1450 N Unit 25
- 1371 N 330 E Unit 8
- 713 E 1500 St N Unit 19
- 1096 E 380 N
- 1744 N 280 W
- 701 E 215 N
- 713 E 1450 N Unit 23
- 747 E 1500 N Unit 13
Your Personal Tour Guide
Ask me questions while you tour the home.