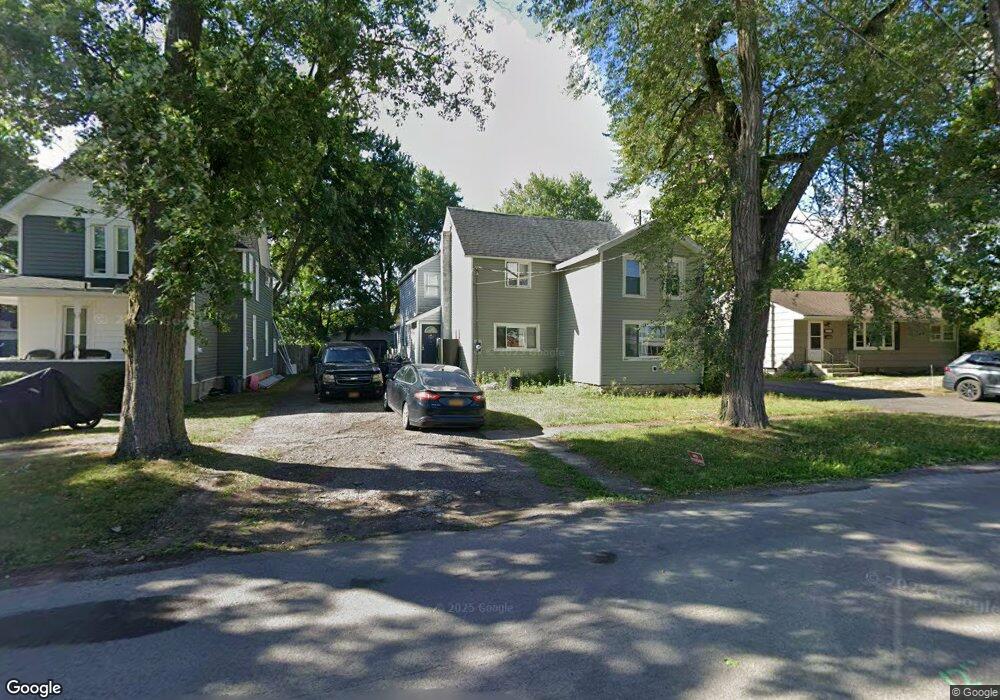
368 Green St Lockport, NY 14094
Estimated Value: $163,000 - $201,000
3
Beds
2
Baths
2,052
Sq Ft
$88/Sq Ft
Est. Value
About This Home
This home is located at 368 Green St, Lockport, NY 14094 and is currently estimated at $181,242, approximately $88 per square foot. 368 Green St is a home located in Niagara County with nearby schools including Aaron Mossell Junior High School, Lockport High School, and DeSales Catholic School.
Ownership History
Date
Name
Owned For
Owner Type
Purchase Details
Closed on
Aug 26, 2015
Sold by
Mccoy Marcus K
Bought by
House Frederick W
Current Estimated Value
Purchase Details
Closed on
Oct 15, 2014
Sold by
City Of Lockport
Bought by
Mccoy Marcus
Purchase Details
Closed on
Oct 14, 2014
Sold by
Niagara County Treasurer
Bought by
Mccoy Marcus K
Purchase Details
Closed on
Sep 9, 2014
Sold by
Gillis Gregory and Rosenbeck John
Bought by
City Of Lockport
Purchase Details
Closed on
Jun 26, 2007
Sold by
Gill Donald
Bought by
Rosenbeck John
Purchase Details
Closed on
Mar 5, 2007
Sold by
Gill Donald
Bought by
Rosenbeck John
Purchase Details
Closed on
Sep 28, 2006
Sold by
First Niagara Bank
Bought by
Gill Donald and Gill
Purchase Details
Closed on
Jun 6, 2006
Sold by
Sec Of Hud
Bought by
First Niagara Bank
Purchase Details
Closed on
Sep 9, 2005
Sold by
Cooper Richard
Bought by
Sec Of Hud
Purchase Details
Closed on
Feb 28, 1995
Sold by
Groffenberg Danny R and Groffenberg Wendy S
Bought by
Cooper Richard J and Cooper Kim M
Create a Home Valuation Report for This Property
The Home Valuation Report is an in-depth analysis detailing your home's value as well as a comparison with similar homes in the area
Home Values in the Area
Average Home Value in this Area
Purchase History
| Date | Buyer | Sale Price | Title Company |
|---|---|---|---|
| House Frederick W | -- | -- | |
| Mccoy Marcus | -- | -- | |
| Mccoy Marcus K | $14,000 | None Available | |
| City Of Lockport | -- | None Available | |
| Rosenbeck John | -- | Charles Ben | |
| Rosenbeck John | $15,000 | Charles Ben | |
| Gill Donald | $1,000 | Anthony C Ben | |
| First Niagara Bank | -- | Steven J Baum | |
| Sec Of Hud | $66,336 | Steven Baum | |
| Cooper Richard J | $70,000 | -- |
Source: Public Records
Tax History Compared to Growth
Tax History
| Year | Tax Paid | Tax Assessment Tax Assessment Total Assessment is a certain percentage of the fair market value that is determined by local assessors to be the total taxable value of land and additions on the property. | Land | Improvement |
|---|---|---|---|---|
| 2024 | $4,228 | $126,000 | $6,800 | $119,200 |
| 2023 | $4,266 | $121,000 | $6,800 | $114,200 |
| 2022 | $2,449 | $110,000 | $6,800 | $103,200 |
| 2021 | $1,830 | $46,400 | $5,900 | $40,500 |
| 2020 | $1,790 | $46,400 | $5,900 | $40,500 |
| 2019 | $389 | $46,400 | $5,900 | $40,500 |
| 2018 | $1,255 | $45,000 | $5,900 | $39,100 |
| 2017 | $1,251 | $45,000 | $5,900 | $39,100 |
| 2016 | $1,211 | $45,000 | $5,900 | $39,100 |
| 2015 | -- | $45,000 | $5,900 | $39,100 |
| 2014 | -- | $45,000 | $5,900 | $39,100 |
Source: Public Records
Map
Nearby Homes
- 362 Green St
- 356 Green St
- 354 Green St
- 325 W Caledonia St
- 321 W Caledonia St
- 327 W Caledonia St
- 346 Green St
- 313 W Caledonia St
- 331 W Caledonia St
- 344 Green St
- 307 W Caledonia St
- 355 Green St
- 335 W Caledonia St
- 345 Green St
- 303 W Caledonia St
- 342 Green St
- 345 W Caledonia St
- 337 Green St
- 299 W Caledonia St
- 295 W Caledonia St