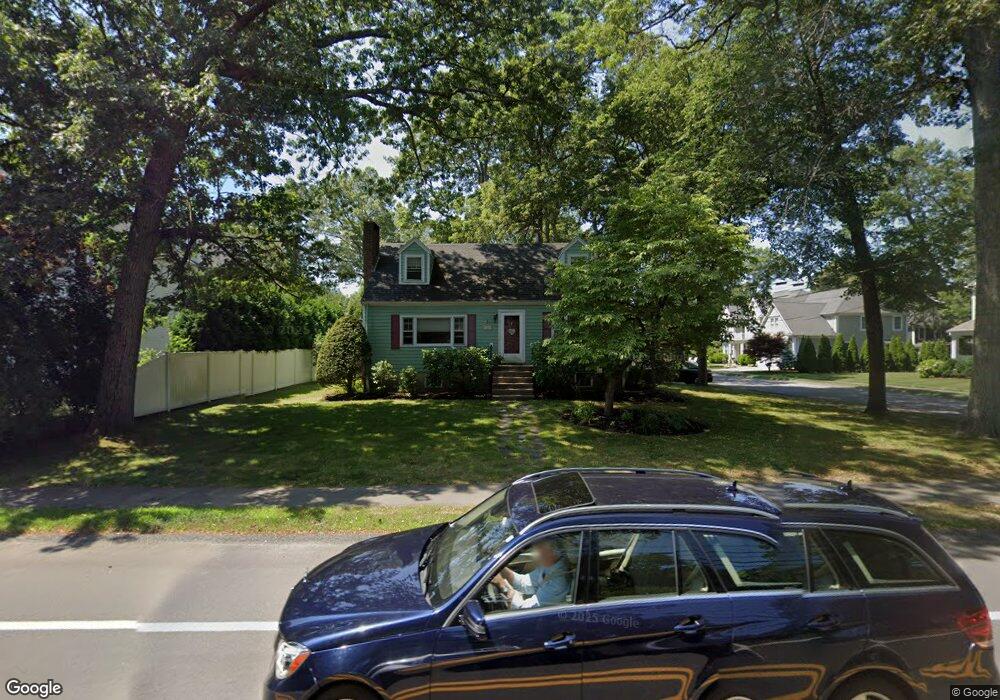
368 High Rock St Needham, MA 02492
Estimated Value: $1,119,000 - $1,296,000
2
Beds
4
Baths
864
Sq Ft
$1,396/Sq Ft
Est. Value
About This Home
This home is located at 368 High Rock St, Needham, MA 02492 and is currently estimated at $1,205,914, approximately $1,395 per square foot. 368 High Rock St is a home located in Norfolk County with nearby schools including Newman Elementary School, High Rock Middle School, and Pollard Middle School.
Ownership History
Date
Name
Owned For
Owner Type
Purchase Details
Closed on
Jun 28, 1996
Sold by
Smith Dickson and Smith Monica A
Bought by
Slatery David T
Current Estimated Value
Purchase Details
Closed on
Dec 14, 1989
Sold by
Clasby Richard J
Bought by
Smith Ii Dickson
Create a Home Valuation Report for This Property
The Home Valuation Report is an in-depth analysis detailing your home's value as well as a comparison with similar homes in the area
Home Values in the Area
Average Home Value in this Area
Purchase History
| Date | Buyer | Sale Price | Title Company |
|---|---|---|---|
| Slatery David T | $277,600 | -- | |
| Slatery David T | $277,600 | -- | |
| Smith Ii Dickson | $219,500 | -- | |
| Smith Dickson | $219,500 | -- |
Source: Public Records
Mortgage History
| Date | Status | Borrower | Loan Amount |
|---|---|---|---|
| Open | Smith Dickson | $188,000 | |
| Closed | Smith Dickson | $225,000 |
Source: Public Records
Tax History Compared to Growth
Tax History
| Year | Tax Paid | Tax Assessment Tax Assessment Total Assessment is a certain percentage of the fair market value that is determined by local assessors to be the total taxable value of land and additions on the property. | Land | Improvement |
|---|---|---|---|---|
| 2025 | $9,901 | $934,100 | $720,800 | $213,300 |
| 2024 | $9,141 | $730,100 | $526,100 | $204,000 |
| 2023 | $9,283 | $711,900 | $526,100 | $185,800 |
| 2022 | $9,042 | $676,300 | $496,300 | $180,000 |
| 2021 | $8,812 | $676,300 | $496,300 | $180,000 |
| 2020 | $8,439 | $675,700 | $496,200 | $179,500 |
| 2019 | $7,792 | $628,900 | $451,100 | $177,800 |
| 2018 | $7,471 | $628,900 | $451,100 | $177,800 |
| 2017 | $7,208 | $606,200 | $451,100 | $155,100 |
| 2016 | $6,996 | $606,200 | $451,100 | $155,100 |
| 2015 | $6,844 | $606,200 | $451,100 | $155,100 |
| 2014 | $6,523 | $560,400 | $410,100 | $150,300 |
Source: Public Records
Map
Nearby Homes
- 364 High Rock St
- 9 Robinwood Ave
- 18 Deerfield Rd
- 5 Deerfield Rd
- 378 High Rock St
- 11 Robinwood Ave
- 367 High Rock St
- 17 Deerfield Rd
- 17 Deerfield Rd Unit XXX
- 17 Deerfield Rd Unit 17
- 367 High Rock St
- 373 High Rock St
- 384 High Rock St
- 361 High Rock St
- 19 Robinwood Ave
- 352 High Rock St
- 381 High Rock St
- 118 Barrett St
- 14 Robinwood Ave
- 27 Deerfield Rd