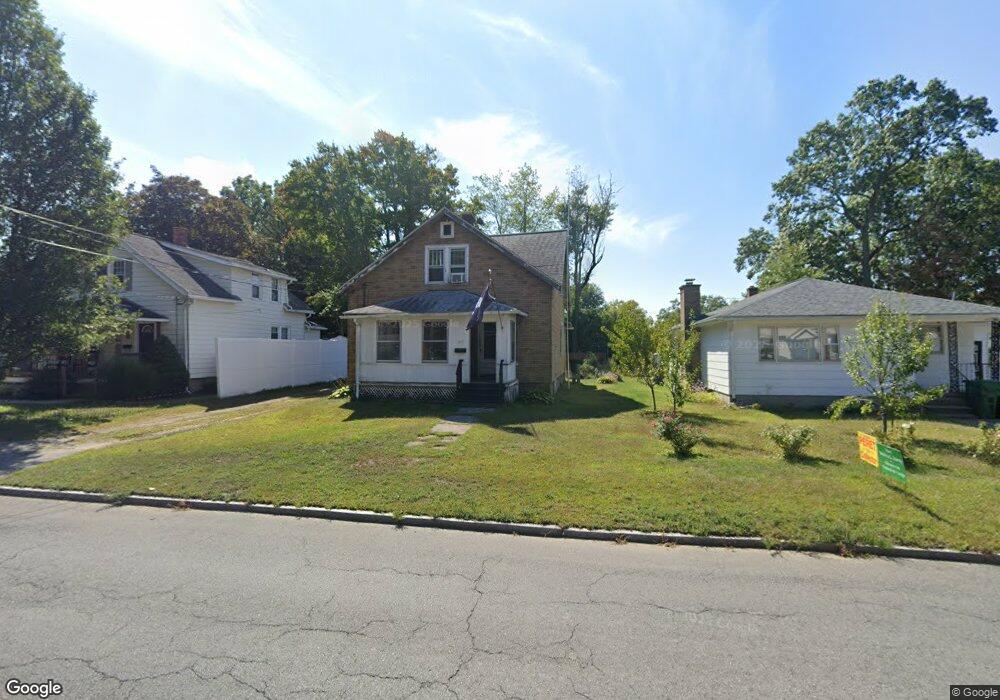
368 James St Chicopee, MA 01020
Fairview NeighborhoodEstimated Value: $224,916 - $290,000
2
Beds
1
Bath
910
Sq Ft
$268/Sq Ft
Est. Value
About This Home
This home is located at 368 James St, Chicopee, MA 01020 and is currently estimated at $244,229, approximately $268 per square foot. 368 James St is a home located in Hampden County with nearby schools including Streiber Elementary School, Fairview Middle School, and Chicopee Comprehensive High School.
Ownership History
Date
Name
Owned For
Owner Type
Purchase Details
Closed on
Jan 25, 2024
Sold by
Klin Michael A
Bought by
Klin Michael A and Klin Philip J
Current Estimated Value
Purchase Details
Closed on
Jan 11, 2016
Sold by
Klin Bernadine E
Bought by
Klin Bernadine E and Klin Michael A
Purchase Details
Closed on
Nov 6, 2013
Sold by
Klin Philip F
Bought by
Klin Bernadine E
Purchase Details
Closed on
Jan 18, 1973
Bought by
Klin Bernadine E and Klin Michael A
Create a Home Valuation Report for This Property
The Home Valuation Report is an in-depth analysis detailing your home's value as well as a comparison with similar homes in the area
Home Values in the Area
Average Home Value in this Area
Purchase History
| Date | Buyer | Sale Price | Title Company |
|---|---|---|---|
| Klin Michael A | -- | None Available | |
| Klin Bernadine E | -- | -- | |
| Klin Bernadine E | -- | -- | |
| Klin Bernadine E | -- | -- |
Source: Public Records
Tax History
| Year | Tax Paid | Tax Assessment Tax Assessment Total Assessment is a certain percentage of the fair market value that is determined by local assessors to be the total taxable value of land and additions on the property. | Land | Improvement |
|---|---|---|---|---|
| 2025 | $2,867 | $189,100 | $89,400 | $99,700 |
| 2024 | $2,720 | $184,300 | $87,600 | $96,700 |
| 2023 | $2,548 | $168,200 | $79,700 | $88,500 |
| 2022 | $2,440 | $143,600 | $69,300 | $74,300 |
| 2021 | $2,300 | $130,600 | $63,000 | $67,600 |
| 2020 | $2,231 | $127,800 | $64,700 | $63,100 |
| 2019 | $2,216 | $123,400 | $64,700 | $58,700 |
| 2018 | $2,173 | $118,700 | $61,600 | $57,100 |
| 2017 | $2,143 | $123,800 | $60,200 | $63,600 |
| 2016 | $2,051 | $121,300 | $60,200 | $61,100 |
| 2015 | $2,170 | $123,700 | $60,200 | $63,500 |
| 2014 | $1,085 | $123,700 | $60,200 | $63,500 |
Source: Public Records
Map
Nearby Homes
Your Personal Tour Guide
Ask me questions while you tour the home.