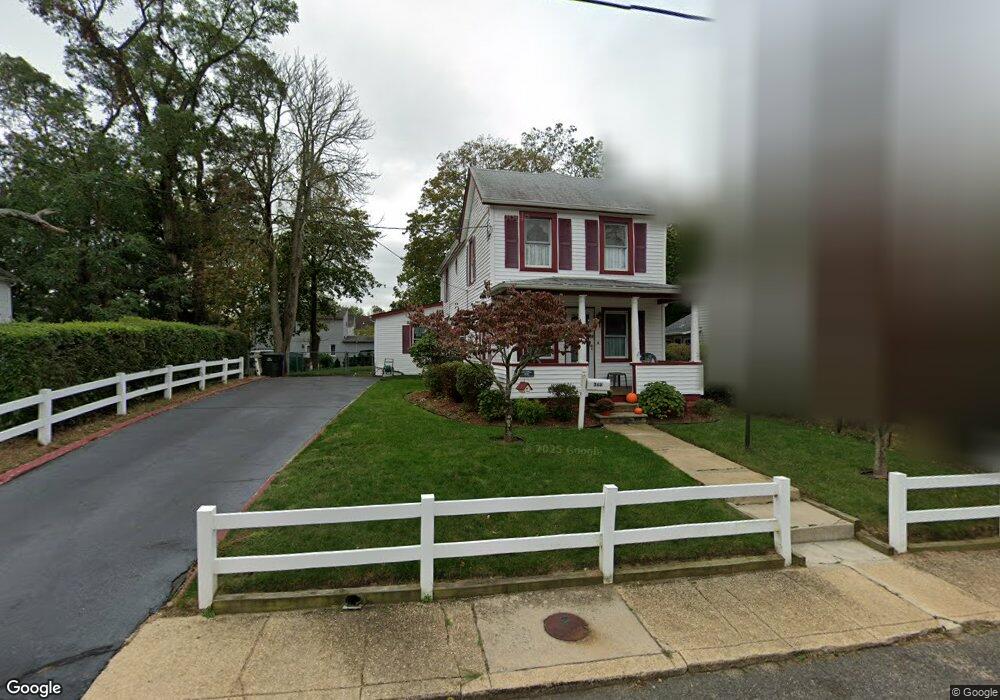
368 Lake Ave Oakhurst, NJ 07755
Estimated Value: $784,374 - $987,000
3
Beds
2
Baths
1,588
Sq Ft
$539/Sq Ft
Est. Value
About This Home
This home is located at 368 Lake Ave, Oakhurst, NJ 07755 and is currently estimated at $856,125, approximately $539 per square foot. 368 Lake Ave is a home located in Monmouth County with nearby schools including Ocean Township High School, Bet Yaakov of the Jersey Shore, and Ma'or Yeshiva High School for Boys.
Ownership History
Date
Name
Owned For
Owner Type
Purchase Details
Closed on
Mar 19, 2010
Sold by
Bonforte Ronald and Estate Of Patricia Bonforte
Bought by
Bonforte Joseph
Current Estimated Value
Home Financials for this Owner
Home Financials are based on the most recent Mortgage that was taken out on this home.
Original Mortgage
$213,675
Outstanding Balance
$140,839
Interest Rate
4.87%
Mortgage Type
FHA
Estimated Equity
$715,286
Create a Home Valuation Report for This Property
The Home Valuation Report is an in-depth analysis detailing your home's value as well as a comparison with similar homes in the area
Home Values in the Area
Average Home Value in this Area
Purchase History
| Date | Buyer | Sale Price | Title Company |
|---|---|---|---|
| Bonforte Joseph | $250,000 | Trident Abstract Title Agenc |
Source: Public Records
Mortgage History
| Date | Status | Borrower | Loan Amount |
|---|---|---|---|
| Open | Bonforte Joseph | $213,675 |
Source: Public Records
Tax History Compared to Growth
Tax History
| Year | Tax Paid | Tax Assessment Tax Assessment Total Assessment is a certain percentage of the fair market value that is determined by local assessors to be the total taxable value of land and additions on the property. | Land | Improvement |
|---|---|---|---|---|
| 2025 | $8,100 | $604,000 | $428,900 | $175,100 |
| 2024 | $11,836 | $568,000 | $396,900 | $171,100 |
| 2023 | $11,836 | $774,100 | $607,800 | $166,300 |
| 2022 | $7,414 | $496,000 | $337,600 | $158,400 |
| 2021 | $7,414 | $400,900 | $260,100 | $140,800 |
| 2020 | $7,920 | $397,800 | $260,100 | $137,700 |
| 2019 | $7,738 | $379,500 | $242,600 | $136,900 |
| 2018 | $6,661 | $318,100 | $187,600 | $130,500 |
| 2017 | $6,749 | $320,900 | $197,600 | $123,300 |
| 2016 | $6,055 | $259,000 | $167,600 | $91,400 |
| 2015 | $6,387 | $276,600 | $187,600 | $89,000 |
| 2014 | $6,306 | $276,800 | $187,600 | $89,200 |
Source: Public Records
Map
Nearby Homes