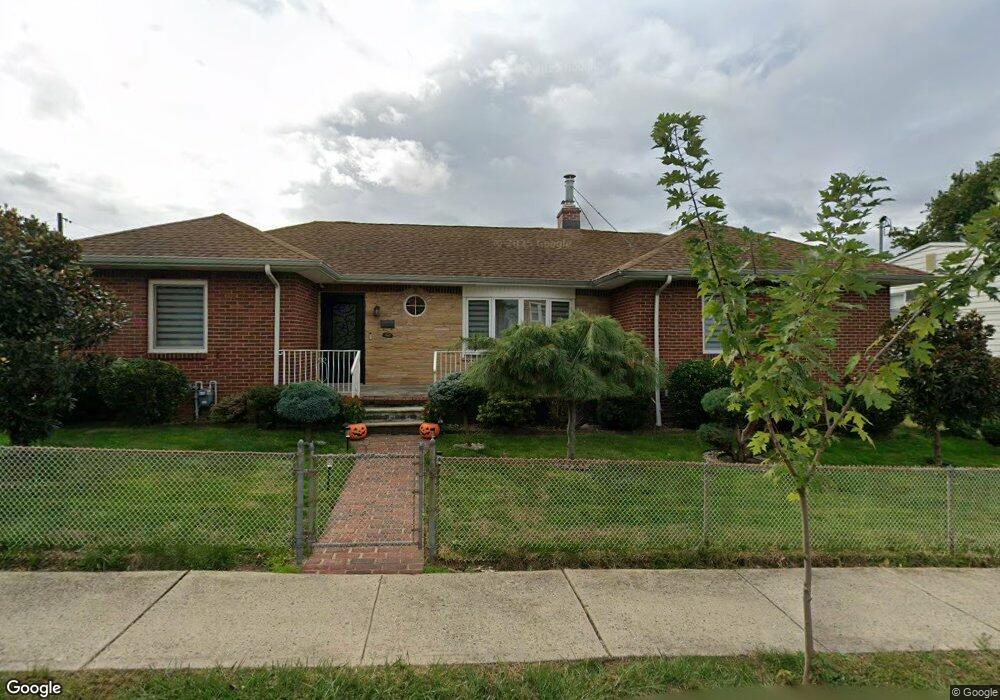
368 Maple Ave Lyndhurst, NJ 07071
Estimated Value: $656,000 - $690,000
Studio
--
Bath
1,458
Sq Ft
$457/Sq Ft
Est. Value
About This Home
This home is located at 368 Maple Ave, Lyndhurst, NJ 07071 and is currently estimated at $666,441, approximately $457 per square foot. 368 Maple Ave is a home located in Bergen County with nearby schools including Lyndhurst High School and Sacred Heart School.
Ownership History
Date
Name
Owned For
Owner Type
Purchase Details
Closed on
Apr 30, 2015
Sold by
Fusaro Luigi and Fusaro Rosario
Bought by
Bladek Mariusz and Bladek Ewa
Current Estimated Value
Home Financials for this Owner
Home Financials are based on the most recent Mortgage that was taken out on this home.
Original Mortgage
$284,000
Outstanding Balance
$218,863
Interest Rate
3.69%
Mortgage Type
New Conventional
Estimated Equity
$447,578
Purchase Details
Closed on
Sep 14, 2001
Sold by
Stern Elaine
Bought by
Fusaro Luigi and Fusaro Rosaria
Create a Home Valuation Report for This Property
The Home Valuation Report is an in-depth analysis detailing your home's value as well as a comparison with similar homes in the area
Home Values in the Area
Average Home Value in this Area
Purchase History
| Date | Buyer | Sale Price | Title Company |
|---|---|---|---|
| Bladek Mariusz | $355,000 | Westcor Land Title | |
| Fusaro Luigi | $280,000 | -- |
Source: Public Records
Mortgage History
| Date | Status | Borrower | Loan Amount |
|---|---|---|---|
| Open | Bladek Mariusz | $284,000 |
Source: Public Records
Tax History
| Year | Tax Paid | Tax Assessment Tax Assessment Total Assessment is a certain percentage of the fair market value that is determined by local assessors to be the total taxable value of land and additions on the property. | Land | Improvement |
|---|---|---|---|---|
| 2025 | $10,676 | $517,700 | $329,700 | $188,000 |
| 2024 | $10,298 | $511,800 | $325,900 | $185,900 |
| 2023 | $7,248 | $506,800 | $323,100 | $183,700 |
| 2022 | $7,248 | $228,500 | $201,000 | $27,500 |
| 2021 | $6,946 | $228,500 | $201,000 | $27,500 |
| 2020 | $6,796 | $228,500 | $201,000 | $27,500 |
| 2019 | $6,745 | $228,500 | $201,000 | $27,500 |
| 2018 | $10,074 | $338,500 | $201,000 | $137,500 |
| 2017 | $9,820 | $338,500 | $201,000 | $137,500 |
| 2016 | $9,600 | $338,500 | $201,000 | $137,500 |
| 2015 | $9,299 | $338,500 | $201,000 | $137,500 |
| 2014 | $9,177 | $338,500 | $201,000 | $137,500 |
Source: Public Records
Map
Nearby Homes
- 416 Kingsland Ave
- 609 Chase Ave
- 521 Weart Ave
- 433 Chase Ave
- 715 Tyler St
- 715 Stuyvesant Ave
- 712 Meyer Ave
- 471 Harding Ave
- 230 New St
- 825 Riverside Ave Unit 204
- 319 Ridge Rd
- 105 Jauncey Ave
- 651 Riverside Ave Unit A7
- 752 Ridge Rd
- 539 Freeman St
- 619 Lewandowski St
- 167 Valley Brook Ave
- 271 Travers Place
- 659 Valley Brook Ave
- 320 Watson Ave
Your Personal Tour Guide
Ask me questions while you tour the home.