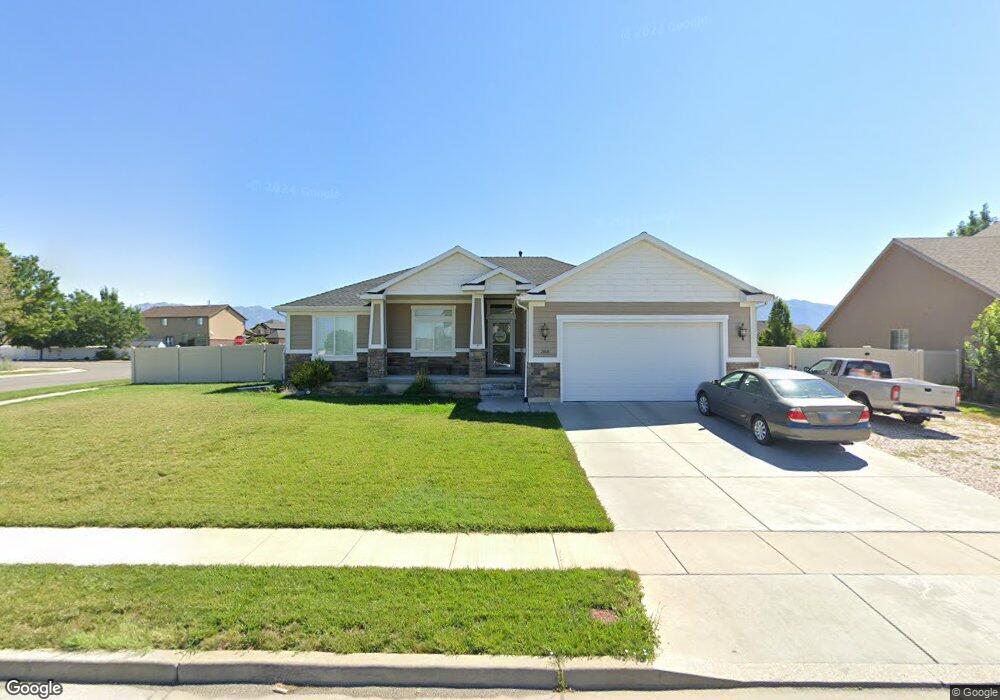
368 N 3675 W Unit 122 Layton, UT 84041
Estimated Value: $648,000 - $758,000
3
Beds
2
Baths
3,244
Sq Ft
$214/Sq Ft
Est. Value
About This Home
This home is located at 368 N 3675 W Unit 122, Layton, UT 84041 and is currently estimated at $693,775, approximately $213 per square foot. 368 N 3675 W Unit 122 is a home located in Davis County with nearby schools including Sand Springs Elementary School, Legacy Junior High School, and Layton High School.
Ownership History
Date
Name
Owned For
Owner Type
Purchase Details
Closed on
Jul 17, 2017
Sold by
Mattson Mark and Mattson Diane
Bought by
Larsen Curtis K and Larsen Kara
Current Estimated Value
Home Financials for this Owner
Home Financials are based on the most recent Mortgage that was taken out on this home.
Original Mortgage
$95,500
Outstanding Balance
$79,261
Interest Rate
3.94%
Mortgage Type
Commercial
Estimated Equity
$614,514
Purchase Details
Closed on
Jan 21, 2015
Sold by
Simmons John E and Simmons Sally A
Bought by
Mattson Mark and Mattson Diane
Home Financials for this Owner
Home Financials are based on the most recent Mortgage that was taken out on this home.
Original Mortgage
$262,080
Interest Rate
3.87%
Mortgage Type
New Conventional
Purchase Details
Closed on
Aug 20, 2012
Sold by
Brighton Bank
Bought by
Simmons John E and Simmons Sally A
Purchase Details
Closed on
Jun 28, 2012
Sold by
Benchmark Real Estate Company and Nelson Brent A
Bought by
Brighton Bank
Create a Home Valuation Report for This Property
The Home Valuation Report is an in-depth analysis detailing your home's value as well as a comparison with similar homes in the area
Home Values in the Area
Average Home Value in this Area
Purchase History
| Date | Buyer | Sale Price | Title Company |
|---|---|---|---|
| Larsen Curtis K | -- | Mountain View Title | |
| Mattson Mark | -- | Founders Title Co | |
| Simmons John E | -- | Founders Title Co La | |
| Brighton Bank | -- | Founders Title Co L |
Source: Public Records
Mortgage History
| Date | Status | Borrower | Loan Amount |
|---|---|---|---|
| Open | Larsen Curtis K | $95,500 | |
| Previous Owner | Mattson Mark | $262,080 |
Source: Public Records
Tax History Compared to Growth
Tax History
| Year | Tax Paid | Tax Assessment Tax Assessment Total Assessment is a certain percentage of the fair market value that is determined by local assessors to be the total taxable value of land and additions on the property. | Land | Improvement |
|---|---|---|---|---|
| 2025 | $3,270 | $343,200 | $126,192 | $217,008 |
| 2024 | $3,256 | $344,300 | $134,946 | $209,354 |
| 2023 | $3,176 | $592,000 | $142,992 | $449,008 |
| 2022 | $3,336 | $337,700 | $83,059 | $254,641 |
| 2021 | $3,220 | $486,000 | $124,568 | $361,432 |
| 2020 | $2,928 | $424,000 | $106,479 | $317,521 |
| 2019 | $3,046 | $432,000 | $105,151 | $326,849 |
| 2018 | $2,563 | $365,000 | $92,674 | $272,326 |
| 2016 | $2,193 | $161,095 | $40,548 | $120,547 |
| 2015 | $2,208 | $153,945 | $40,548 | $113,397 |
| 2014 | $1,034 | $73,723 | $73,723 | $0 |
| 2013 | -- | $74,024 | $74,024 | $0 |
Source: Public Records
Map
Nearby Homes
- 3169 S 550 W
- 454 N 3550 W
- 567 W 3575 S
- 101 S 3600 W
- 697 N 3275 W
- 3263 W 850 N
- 967 W Yamada Ct
- 3583 W 200 S
- 803 W 2800 S
- 3535 W Overlook Dr
- 1139 W 3150 S
- 245 S Summer Breeze Ln
- 3391 W 1125 N
- 3528 S Finch St
- 475 W 2400 S
- 2674 S 75 E
- 3067 S Old Emigrant Rd Unit B
- 2784 S 1720 W Unit F
- 3637 S Creek Side Ln
- 2766 S 1200 W