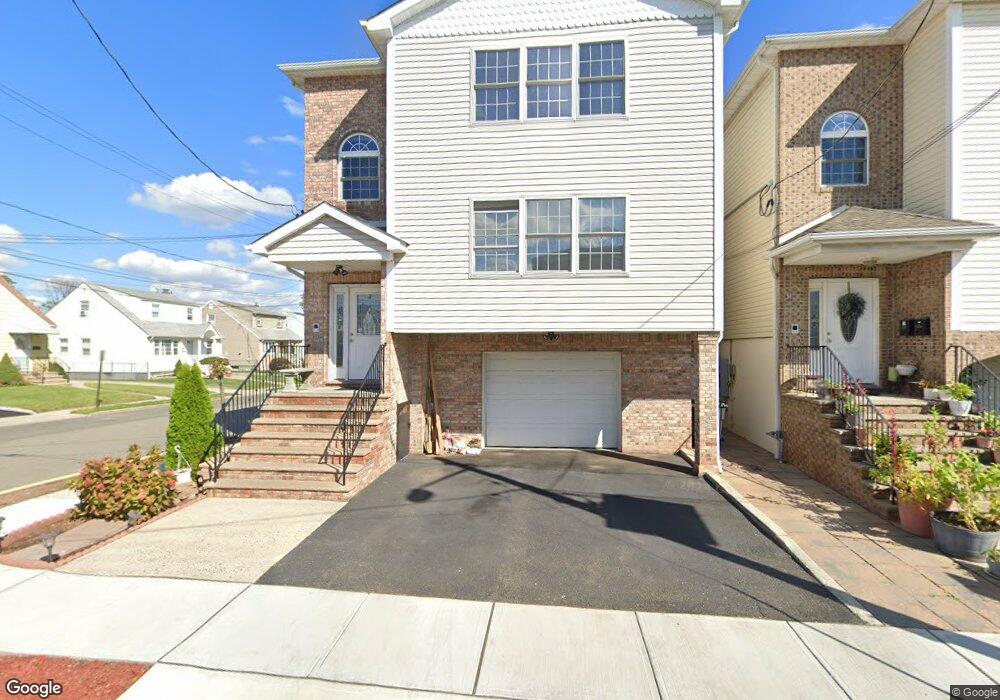
368 Nelson Ave Elizabeth, NJ 07202
Bayway NeighborhoodEstimated Value: $876,000 - $971,833
Studio
--
Bath
2,856
Sq Ft
$328/Sq Ft
Est. Value
About This Home
This home is located at 368 Nelson Ave, Elizabeth, NJ 07202 and is currently estimated at $936,958, approximately $328 per square foot. 368 Nelson Ave is a home with nearby schools including Elizabeth High School and JVJ STEM Academy - School No. 92.
Ownership History
Date
Name
Owned For
Owner Type
Purchase Details
Closed on
Feb 28, 2017
Sold by
Lomba Enrique and Leyva Leydis
Bought by
Mendez Vinicio and Ortiz Marianela R Reinoso
Current Estimated Value
Home Financials for this Owner
Home Financials are based on the most recent Mortgage that was taken out on this home.
Original Mortgage
$446,758
Outstanding Balance
$366,071
Interest Rate
3.75%
Mortgage Type
FHA
Estimated Equity
$570,887
Purchase Details
Closed on
Jun 25, 2010
Sold by
625 Grove Street Llc
Bought by
Lomba Enrique and Leyva Leydis
Home Financials for this Owner
Home Financials are based on the most recent Mortgage that was taken out on this home.
Original Mortgage
$432,030
Interest Rate
5.25%
Mortgage Type
FHA
Purchase Details
Closed on
Nov 28, 2006
Sold by
Social Portuguese Instructive
Bought by
625 Grove Street Llc
Home Financials for this Owner
Home Financials are based on the most recent Mortgage that was taken out on this home.
Original Mortgage
$1,962,500
Interest Rate
6.31%
Mortgage Type
Purchase Money Mortgage
Create a Home Valuation Report for This Property
The Home Valuation Report is an in-depth analysis detailing your home's value as well as a comparison with similar homes in the area
Home Values in the Area
Average Home Value in this Area
Purchase History
| Date | Buyer | Sale Price | Title Company |
|---|---|---|---|
| Mendez Vinicio | $455,000 | Old Republic National Title | |
| Lomba Enrique | $440,000 | Chicago Title Insurance Co | |
| 625 Grove Street Llc | $950,000 | -- |
Source: Public Records
Mortgage History
| Date | Status | Borrower | Loan Amount |
|---|---|---|---|
| Open | Mendez Vinicio | $446,758 | |
| Previous Owner | Lomba Enrique | $432,030 | |
| Previous Owner | 625 Grove Street Llc | $1,962,500 |
Source: Public Records
Tax History
| Year | Tax Paid | Tax Assessment Tax Assessment Total Assessment is a certain percentage of the fair market value that is determined by local assessors to be the total taxable value of land and additions on the property. | Land | Improvement |
|---|---|---|---|---|
| 2025 | $16,327 | $848,600 | $353,300 | $495,300 |
| 2024 | $15,526 | $848,600 | $353,300 | $495,300 |
| 2023 | $15,526 | $49,400 | $10,200 | $39,200 |
| 2022 | $15,106 | $49,400 | $10,200 | $39,200 |
| 2021 | $14,794 | $49,400 | $10,200 | $39,200 |
| 2020 | $14,460 | $49,400 | $10,200 | $39,200 |
| 2019 | $14,239 | $49,400 | $10,200 | $39,200 |
| 2018 | $14,100 | $49,400 | $10,200 | $39,200 |
| 2017 | $13,707 | $49,400 | $10,200 | $39,200 |
| 2016 | $13,708 | $49,400 | $10,200 | $39,200 |
| 2015 | $2,662 | $52,000 | $10,200 | $41,800 |
| 2014 | $2,582 | $52,000 | $10,200 | $41,800 |
Source: Public Records
Map
Nearby Homes
- 350 Williamson St
- 652 54 1st Ave
- 147 Liberty St Unit 149
- 225 S Broad St Unit 1-D
- 225 S Broad St Unit 1-E
- 322 S 7th St
- 614 12 4th Ave
- 519 Maple Ave
- 534-536 Maple Ave
- 529 Maple Ave
- 328 John St
- 312 S Spring St
- 521 Maple Ave
- 316-318 John St
- 546 S Broad St
- 840 Grove St
- 313 Washington Ave
- 221 Center St
- 230 Christine St Unit 32
- 213 High St Unit 217
- 374 Nelson Ave
- 370 Nelson Ave
- 372 Nelson Ave
- 631 Devine Ave
- 629 Devine Ave Unit 631
- 627 Devine Ave Unit 629
- 623 Devine Ave Unit 625
- 632-634 Devine Ave
- 632 Devine Ave Unit 634
- 376 Nelson Ave
- 633 Devine Ave
- 621 Devine Ave Unit 623
- 635 Devine Ave
- 633 Grove St Unit 635
- 636-638 Devine Ave
- 636 Devine Ave Unit 638
- 637 Devine Ave
- 619 Devine Ave Unit 621
- 637 Grove St Unit 39
- 632 Montgomery St
Your Personal Tour Guide
Ask me questions while you tour the home.