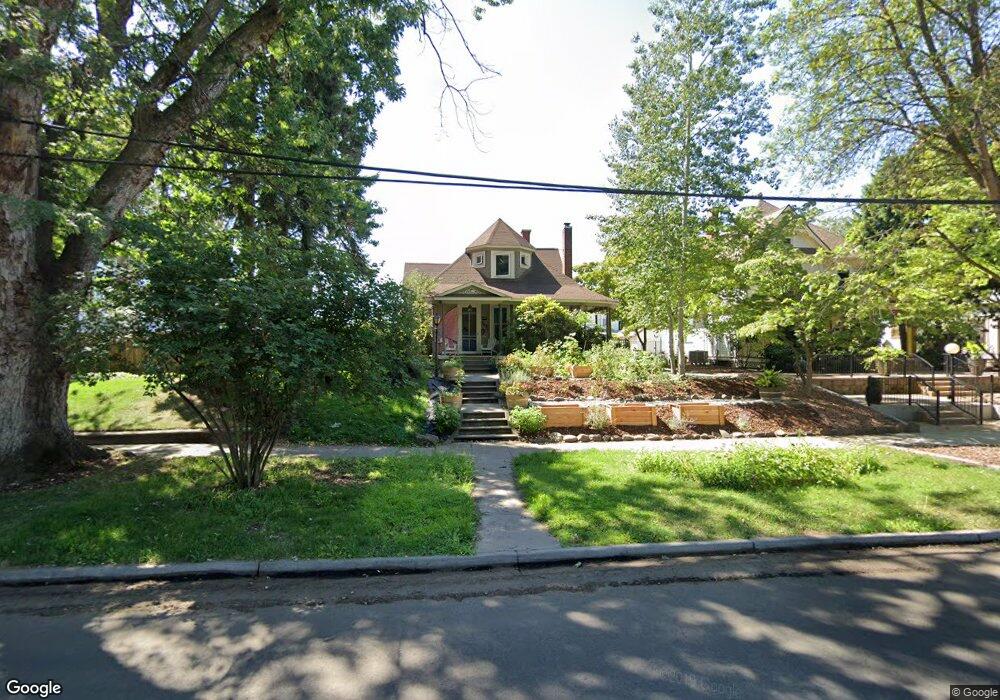
368 S 3rd Ave Walla Walla, WA 99362
Estimated Value: $396,381 - $514,000
4
Beds
2
Baths
1,902
Sq Ft
$246/Sq Ft
Est. Value
About This Home
This home is located at 368 S 3rd Ave, Walla Walla, WA 99362 and is currently estimated at $467,095, approximately $245 per square foot. 368 S 3rd Ave is a home located in Walla Walla County with nearby schools including Sharpstein Elementary School, Garrison Middle School, and Willow Public School.
Ownership History
Date
Name
Owned For
Owner Type
Purchase Details
Closed on
Aug 16, 2011
Sold by
Lizut Roger and Rokoff Lizut Sandra
Bought by
Anderson Theodore M and Anderson Ariel L
Current Estimated Value
Home Financials for this Owner
Home Financials are based on the most recent Mortgage that was taken out on this home.
Original Mortgage
$194,750
Outstanding Balance
$11,742
Interest Rate
4.53%
Mortgage Type
New Conventional
Estimated Equity
$455,353
Purchase Details
Closed on
Jul 24, 2007
Sold by
Johnson Kevin and Kjellstrand Cecillia
Bought by
Lizut Robger and Lizut Sandra Rokoff
Create a Home Valuation Report for This Property
The Home Valuation Report is an in-depth analysis detailing your home's value as well as a comparison with similar homes in the area
Purchase History
| Date | Buyer | Sale Price | Title Company |
|---|---|---|---|
| Anderson Theodore M | $205,000 | Pioneer Title Company Of Wal | |
| Lizut Robger | $273,000 | Land Title Of Walla Walla Co |
Source: Public Records
Mortgage History
| Date | Status | Borrower | Loan Amount |
|---|---|---|---|
| Open | Anderson Theodore M | $194,750 |
Source: Public Records
Tax History
| Year | Tax Paid | Tax Assessment Tax Assessment Total Assessment is a certain percentage of the fair market value that is determined by local assessors to be the total taxable value of land and additions on the property. | Land | Improvement |
|---|---|---|---|---|
| 2025 | $3,931 | $397,050 | $72,000 | $325,050 |
| 2024 | $3,062 | $397,050 | $72,000 | $325,050 |
| 2023 | $3,062 | $345,740 | $45,000 | $300,740 |
| 2022 | $2,956 | $318,400 | $45,000 | $273,400 |
| 2021 | $2,807 | $272,830 | $45,000 | $227,830 |
| 2020 | $2,775 | $234,860 | $45,000 | $189,860 |
| 2019 | $2,539 | $234,860 | $45,000 | $189,860 |
| 2018 | $2,722 | $234,860 | $45,000 | $189,860 |
| 2017 | $2,428 | $206,160 | $43,200 | $162,960 |
| 2016 | $2,553 | $198,400 | $43,200 | $155,200 |
| 2015 | $2,497 | $198,400 | $43,200 | $155,200 |
| 2014 | -- | $198,400 | $43,200 | $155,200 |
| 2013 | -- | $198,400 | $43,200 | $155,200 |
Source: Public Records
Map
Nearby Homes
Your Personal Tour Guide
Ask me questions while you tour the home.