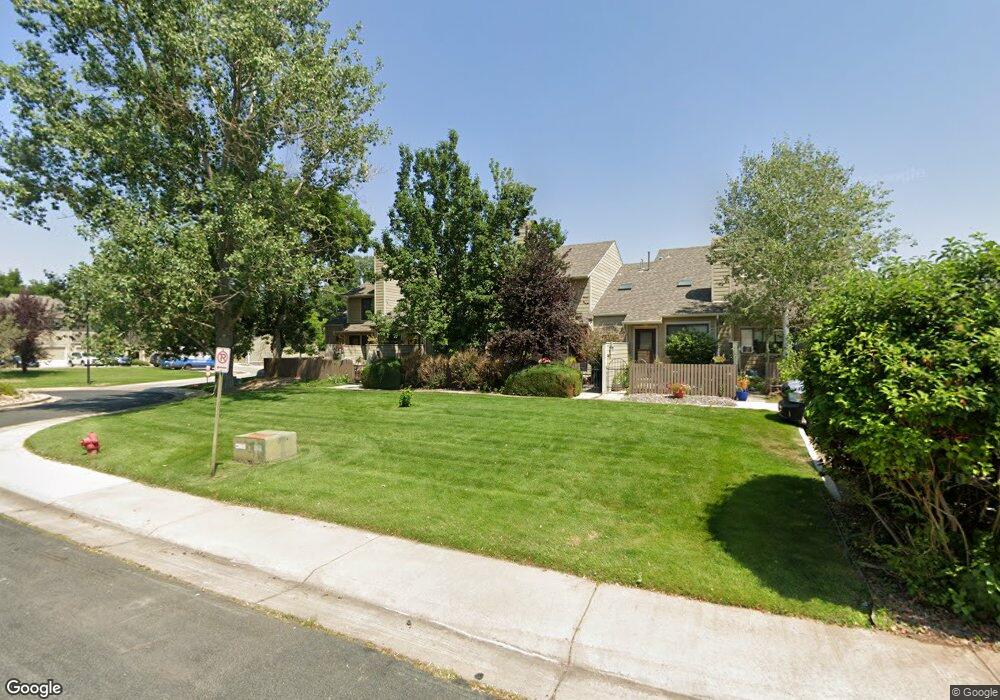
368 S Taft Ct Unit 111 Louisville, CO 80027
Estimated Value: $428,000 - $450,000
2
Beds
2
Baths
970
Sq Ft
$451/Sq Ft
Est. Value
About This Home
This home is located at 368 S Taft Ct Unit 111, Louisville, CO 80027 and is currently estimated at $437,040, approximately $450 per square foot. 368 S Taft Ct Unit 111 is a home located in Boulder County with nearby schools including Fireside Elementary School, Monarch K-8 School, and Monarch High School.
Ownership History
Date
Name
Owned For
Owner Type
Purchase Details
Closed on
Sep 25, 1998
Sold by
Colburn Karen L
Bought by
Marsh Jerry W and Marsh Sandra S
Current Estimated Value
Home Financials for this Owner
Home Financials are based on the most recent Mortgage that was taken out on this home.
Original Mortgage
$97,900
Outstanding Balance
$21,453
Interest Rate
6.91%
Estimated Equity
$415,587
Purchase Details
Closed on
Apr 26, 1996
Sold by
Greenwood M A
Bought by
Salazar Joseph E
Home Financials for this Owner
Home Financials are based on the most recent Mortgage that was taken out on this home.
Original Mortgage
$84,700
Interest Rate
7.78%
Purchase Details
Closed on
Mar 31, 1987
Bought by
Marsh Jerry W and Marsh Sandra S
Purchase Details
Closed on
May 22, 1984
Bought by
Marsh Jerry W and Marsh Sandra S
Create a Home Valuation Report for This Property
The Home Valuation Report is an in-depth analysis detailing your home's value as well as a comparison with similar homes in the area
Home Values in the Area
Average Home Value in this Area
Purchase History
| Date | Buyer | Sale Price | Title Company |
|---|---|---|---|
| Marsh Jerry W | $128,900 | -- | |
| Colburn Karen L | -- | -- | |
| Salazar Joseph E | $105,900 | -- | |
| Marsh Jerry W | -- | -- | |
| Marsh Jerry W | $74,400 | -- |
Source: Public Records
Mortgage History
| Date | Status | Borrower | Loan Amount |
|---|---|---|---|
| Open | Marsh Jerry W | $97,900 | |
| Previous Owner | Salazar Joseph E | $84,700 |
Source: Public Records
Tax History Compared to Growth
Tax History
| Year | Tax Paid | Tax Assessment Tax Assessment Total Assessment is a certain percentage of the fair market value that is determined by local assessors to be the total taxable value of land and additions on the property. | Land | Improvement |
|---|---|---|---|---|
| 2025 | $2,516 | $30,500 | -- | $30,500 |
| 2024 | $2,516 | $30,500 | -- | $30,500 |
| 2023 | $2,473 | $27,989 | -- | $31,674 |
| 2022 | $2,263 | $23,519 | $0 | $23,519 |
| 2021 | $2,576 | $27,814 | $0 | $27,814 |
| 2020 | $2,349 | $25,097 | $0 | $25,097 |
| 2019 | $2,315 | $25,097 | $0 | $25,097 |
| 2018 | $2,129 | $23,825 | $0 | $23,825 |
| 2017 | $2,086 | $26,340 | $0 | $26,340 |
| 2016 | $1,675 | $19,040 | $0 | $19,040 |
| 2015 | $1,588 | $15,737 | $0 | $15,737 |
| 2014 | $1,345 | $15,737 | $0 | $15,737 |
Source: Public Records
Map
Nearby Homes
- 362 S Taft Ct Unit 108
- 284 S Taft Ct Unit 76
- 323 S Taft Ct Unit 26
- 305 S Taft Ct Unit 33
- 279 S Taft Ct Unit 53
- 749 Apple Ct
- 641 W Dahlia St
- 567 Manorwood Ln
- 539 Coal Creek Ln
- 546 Ridgeview Dr
- 159 S Polk Ave
- 118 S Tanager Ct
- 572 Ridgeview Dr
- 322 Diamond Cir
- 620 Ridgeview Dr
- 812 W Mulberry St
- 203 Springs Dr
- 716 Club Cir
- 408 Fillmore Ct
- 730 Copper Ln Unit 106
- 374 S Taft Ct Unit 114
- 372 S Taft Ct Unit 113
- 370 S Taft Ct Unit 112
- 366 S Taft Ct Unit 110
- 364 S Taft Ct Unit 109
- 364 S Taft Ct Unit 19109
- 680 W Chestnut Ct
- 388 S Taft Ct Unit 126
- 390 S Taft Ct Unit 125
- 392 S Taft Ct Unit 124
- 394 S Taft Ct Unit 123
- 396 S Taft Ct Unit 122
- 398 S Taft Ct Unit 121
- 386 S Taft Ct Unit 120
- 384 S Taft Ct Unit 119
- 382 S Taft Ct Unit 118
- 378 S Taft Ct Unit 116
- 376 S Taft Ct Unit 115
- 362 S Taft Ct Unit 18-108
- 670 W Chestnut Ct