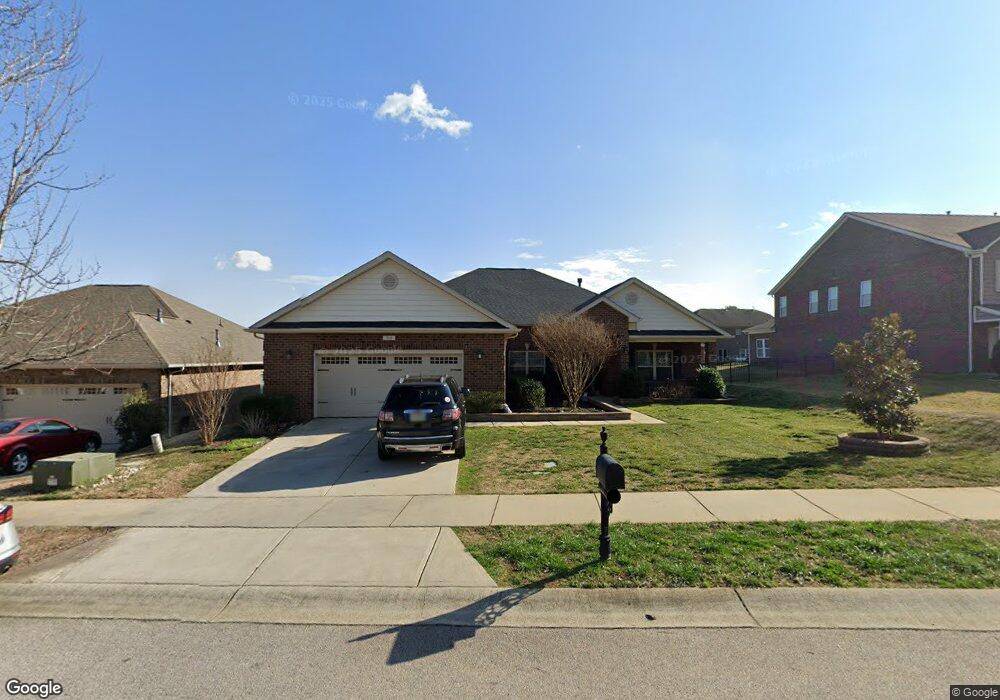
368 Village Loop Dr Unit 74 Rock Hill, SC 29732
Estimated Value: $502,000 - $582,000
--
Bed
1
Bath
2,956
Sq Ft
$181/Sq Ft
Est. Value
About This Home
This home is located at 368 Village Loop Dr Unit 74, Rock Hill, SC 29732 and is currently estimated at $535,996, approximately $181 per square foot. 368 Village Loop Dr Unit 74 is a home located in York County with nearby schools including W.C. Sullivan Middle School, Rock Hill High School, and St. Anne Catholic School.
Ownership History
Date
Name
Owned For
Owner Type
Purchase Details
Closed on
Jul 14, 2017
Sold by
Adams Homes Aec Llc
Bought by
Washington Larry W and Washington Margie
Current Estimated Value
Home Financials for this Owner
Home Financials are based on the most recent Mortgage that was taken out on this home.
Original Mortgage
$285,510
Outstanding Balance
$236,056
Interest Rate
3.89%
Mortgage Type
FHA
Estimated Equity
$299,940
Purchase Details
Closed on
Sep 9, 2013
Sold by
Anderko Paul Edward and Anderko Maureen Annora
Bought by
Anderko Paul Edward and Anderko Maureen Annora
Purchase Details
Closed on
Nov 16, 2011
Sold by
Cline David
Bought by
Anderko Paul and Anderko Maureen
Purchase Details
Closed on
Mar 30, 2011
Sold by
Citizens South Bank
Bought by
Cline David
Purchase Details
Closed on
Jul 26, 2010
Sold by
Castlestone Homes Llc
Bought by
Citizens South Bank
Create a Home Valuation Report for This Property
The Home Valuation Report is an in-depth analysis detailing your home's value as well as a comparison with similar homes in the area
Home Values in the Area
Average Home Value in this Area
Purchase History
| Date | Buyer | Sale Price | Title Company |
|---|---|---|---|
| Washington Larry W | $298,000 | None Available | |
| Anderko Paul Edward | -- | -- | |
| Anderko Paul | $22,500 | -- | |
| Cline David | $25,000 | -- | |
| Citizens South Bank | $55,250 | -- |
Source: Public Records
Mortgage History
| Date | Status | Borrower | Loan Amount |
|---|---|---|---|
| Open | Washington Larry W | $285,510 |
Source: Public Records
Tax History Compared to Growth
Tax History
| Year | Tax Paid | Tax Assessment Tax Assessment Total Assessment is a certain percentage of the fair market value that is determined by local assessors to be the total taxable value of land and additions on the property. | Land | Improvement |
|---|---|---|---|---|
| 2025 | $3,172 | $14,759 | $1,961 | $12,798 |
| 2024 | $2,816 | $12,834 | $1,668 | $11,166 |
| 2023 | $2,823 | $12,834 | $1,667 | $11,167 |
| 2022 | $2,843 | $12,834 | $1,667 | $11,167 |
| 2021 | -- | $12,834 | $1,667 | $11,167 |
| 2020 | $2,849 | $12,834 | $0 | $0 |
| 2019 | $2,556 | $11,160 | $0 | $0 |
| 2018 | $2,552 | $11,160 | $0 | $0 |
| 2017 | $872 | $16,740 | $0 | $0 |
| 2016 | $855 | $2,160 | $0 | $0 |
| 2014 | $911 | $2,160 | $2,160 | $0 |
| 2013 | $911 | $2,100 | $2,100 | $0 |
Source: Public Records
Map
Nearby Homes
- 1412 Ebinport Rd
- 128 Front Porch Dr
- 1948 Marett Blvd
- 1321 Ebinport Rd
- 2009 Pinevalley Rd
- 1505 Bellridge Rd
- 1579 Matthews Dr
- 1738 Northgate Ln
- 1811 Charter Dr
- 1155 Cedar Grove Ln
- 1013 Ragin Ln
- 1352 Steed St
- 1845 Matthews Dr
- 1631 Wendover Ct
- 1151 Mckinnon Dr
- 2016 Celanese Rd
- 1149 Mckinnon Dr
- 1138 Deas St
- 3708 Celanese Rd
- 1755 Mount Gallant Rd
- 368 Village Loop Dr
- 374 Village Loop Dr
- 374 Village Loop Dr Unit 73
- 354 Village Loop Dr
- 378 Village Loop Dr Unit 72
- 378 Village Loop Dr
- 419 Red Door Dr Unit 67
- 419 Red Door Dr
- 423 Red Door Dr Unit 68
- 423 Red Door Dr
- 413 Red Door Dr Unit 66
- 369 Village Loop Dr Unit 12
- 369 Village Loop Dr
- 429 Red Door Dr Unit 69
- 429 Red Door Dr
- 373 Village Loop Dr Unit 13
- 373 Village Loop Dr
- 388 Village Loop Dr
- 407 Red Door Dr
- 379 Village Loop Dr