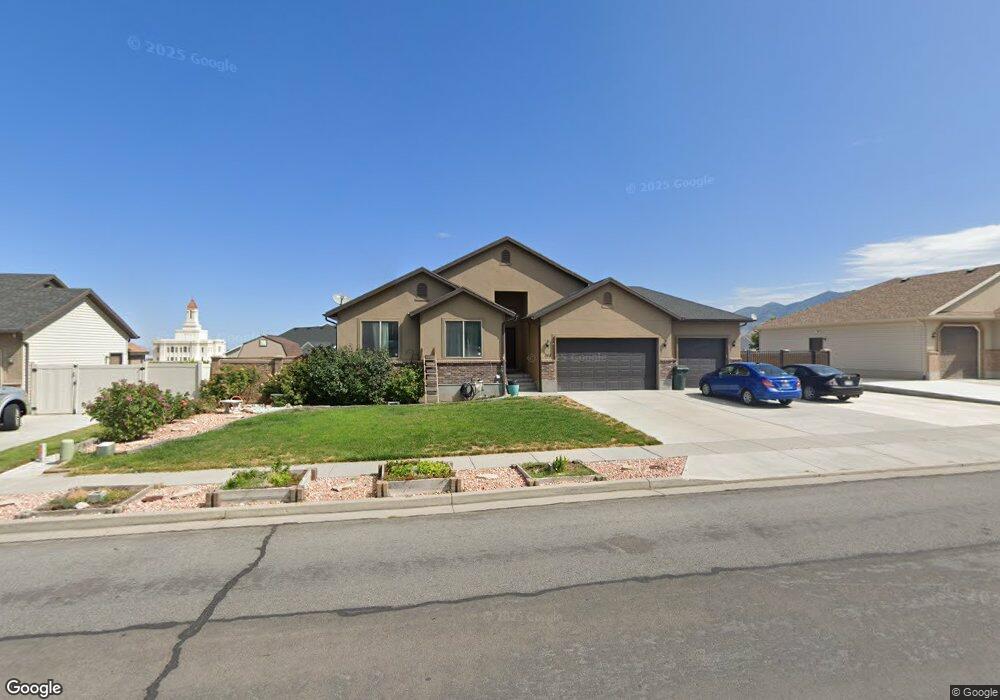
368 W 2200 N Unit 2 Tooele, UT 84074
Estimated Value: $524,521 - $585,000
--
Bed
--
Bath
3,246
Sq Ft
$170/Sq Ft
Est. Value
About This Home
This home is located at 368 W 2200 N Unit 2, Tooele, UT 84074 and is currently estimated at $550,880, approximately $169 per square foot. 368 W 2200 N Unit 2 is a home located in Tooele County with nearby schools including Overlake Elementary School, Clarke N. Johnsen Junior High School, and Stansbury High School.
Ownership History
Date
Name
Owned For
Owner Type
Purchase Details
Closed on
May 30, 2018
Sold by
Jensen Bobbi and Goodfelow Bobbi
Bought by
Jensen Bobbi and Moosman Russ
Current Estimated Value
Home Financials for this Owner
Home Financials are based on the most recent Mortgage that was taken out on this home.
Original Mortgage
$252,543
Outstanding Balance
$219,620
Interest Rate
4.75%
Mortgage Type
FHA
Estimated Equity
$331,260
Purchase Details
Closed on
May 10, 2017
Sold by
Jensen James B
Bought by
Goodfelow Bobbi and Jensen Bobbi Jean
Purchase Details
Closed on
May 27, 2014
Sold by
Hallmark Homes And Development
Bought by
Goodfellow Bobbi and Jensen James B
Home Financials for this Owner
Home Financials are based on the most recent Mortgage that was taken out on this home.
Original Mortgage
$232,707
Interest Rate
3.75%
Mortgage Type
FHA
Create a Home Valuation Report for This Property
The Home Valuation Report is an in-depth analysis detailing your home's value as well as a comparison with similar homes in the area
Home Values in the Area
Average Home Value in this Area
Purchase History
| Date | Buyer | Sale Price | Title Company |
|---|---|---|---|
| Jensen Bobbi | -- | Advantage Title Llc | |
| Goodfelow Bobbi | -- | Vanguard Title Insurance Age | |
| Goodfellow Bobbi | -- | Metro National Title |
Source: Public Records
Mortgage History
| Date | Status | Borrower | Loan Amount |
|---|---|---|---|
| Open | Jensen Bobbi | $252,543 | |
| Closed | Goodfellow Bobbi | $232,707 |
Source: Public Records
Tax History Compared to Growth
Tax History
| Year | Tax Paid | Tax Assessment Tax Assessment Total Assessment is a certain percentage of the fair market value that is determined by local assessors to be the total taxable value of land and additions on the property. | Land | Improvement |
|---|---|---|---|---|
| 2025 | $3,129 | $260,955 | $59,813 | $201,142 |
| 2024 | $3,421 | $261,087 | $59,813 | $201,274 |
| 2023 | $3,421 | $254,588 | $56,955 | $197,633 |
| 2022 | $2,943 | $253,218 | $69,768 | $183,450 |
| 2021 | $2,526 | $181,781 | $22,928 | $158,853 |
| 2020 | $2,476 | $309,117 | $41,688 | $267,429 |
| 2019 | $2,319 | $284,805 | $41,688 | $243,117 |
| 2018 | $2,277 | $265,108 | $40,000 | $225,108 |
| 2017 | $1,919 | $265,108 | $40,000 | $225,108 |
| 2016 | $1,706 | $124,108 | $16,500 | $107,608 |
| 2015 | $1,706 | $124,108 | $0 | $0 |
| 2014 | -- | $124,108 | $0 | $0 |
Source: Public Records
Map
Nearby Homes
- 2098 N 425 W Unit 240
- 2157 N 425 W Unit 233
- 2178 N 220 W
- 2297 N 250 W
- 2067 N 450 W Unit 206
- 2155 N 170 W
- 2117 N 170 W
- Franklin Plan at Compass Point
- Ash Plan at Compass Point
- Chapman Plan at Compass Point
- Kennedy Plan at Compass Point
- McKinley Plan at Compass Point
- Hickory Plan at Compass Point
- Spruce Pantry Plan at Compass Point
- Holly Plan at Compass Point
- Basswood Plan at Compass Point
- Merriwood Plan at Compass Point
- Hancock Plan at Compass Point
- Harrison Plan at Compass Point
- Cedar Plan at Compass Point