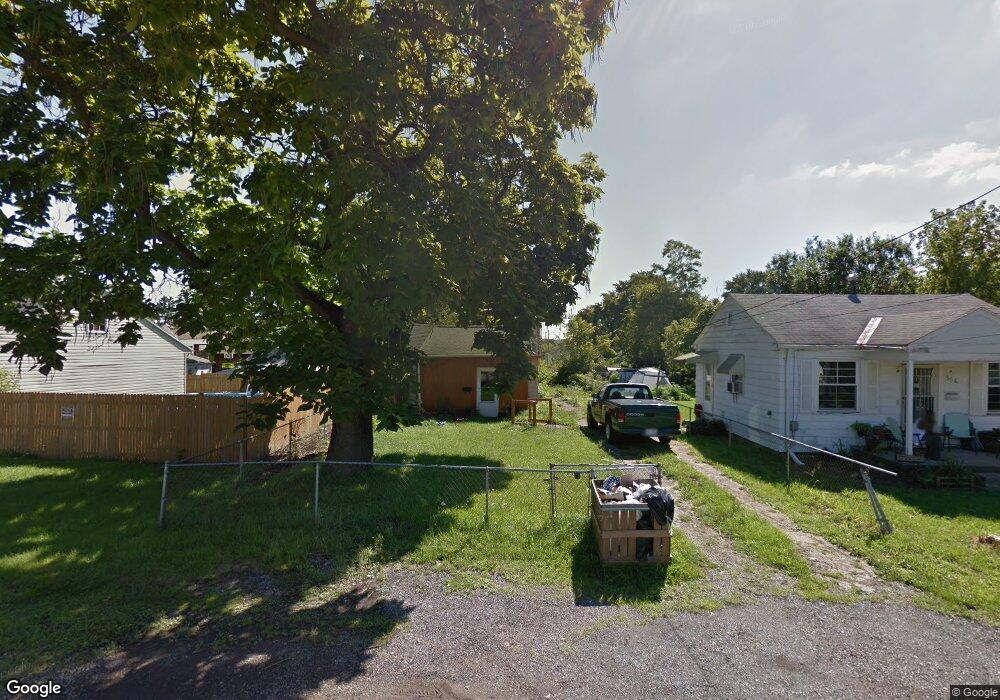
368 Wheatrow Ave Mansfield, OH 44903
Estimated Value: $58,817 - $85,000
1
Bed
1
Bath
700
Sq Ft
$96/Sq Ft
Est. Value
About This Home
This home is located at 368 Wheatrow Ave, Mansfield, OH 44903 and is currently estimated at $67,454, approximately $96 per square foot. 368 Wheatrow Ave is a home located in Richland County with nearby schools including Goal Digital Academy, St. Peter's Elementary/Montessori School, and St. Peter's Junior High / High School.
Ownership History
Date
Name
Owned For
Owner Type
Purchase Details
Closed on
Sep 18, 2006
Sold by
Merwine Larry D and Merwine Larry
Bought by
Synergy Property Solutions Inc
Current Estimated Value
Purchase Details
Closed on
Dec 29, 2005
Sold by
Davis Benjamin and Davis Rebecca J
Bought by
Merwine Larry
Purchase Details
Closed on
Nov 1, 2004
Sold by
Davis Ben A
Bought by
Yarman Lori and Rush Rodney
Home Financials for this Owner
Home Financials are based on the most recent Mortgage that was taken out on this home.
Original Mortgage
$12,400
Interest Rate
9.81%
Mortgage Type
Seller Take Back
Purchase Details
Closed on
Sep 18, 2001
Sold by
Crawford Dana
Bought by
Davis Benjamin
Purchase Details
Closed on
Aug 7, 2001
Sold by
Shrf Curtis Wycoff Pr
Bought by
Crawford Dana and Crawford Ronald
Purchase Details
Closed on
Feb 12, 1992
Sold by
Wycoff Tammy
Bought by
Wycoff Tammy
Purchase Details
Closed on
Jun 26, 1990
Create a Home Valuation Report for This Property
The Home Valuation Report is an in-depth analysis detailing your home's value as well as a comparison with similar homes in the area
Home Values in the Area
Average Home Value in this Area
Purchase History
| Date | Buyer | Sale Price | Title Company |
|---|---|---|---|
| Synergy Property Solutions Inc | -- | None Available | |
| Merwine Larry | $8,500 | None Available | |
| Yarman Lori | $12,400 | -- | |
| Davis Benjamin | $10,000 | -- | |
| Crawford Dana | $6,000 | -- | |
| Wycoff Tammy | -- | -- | |
| -- | $8,000 | -- |
Source: Public Records
Mortgage History
| Date | Status | Borrower | Loan Amount |
|---|---|---|---|
| Previous Owner | Yarman Lori | $12,400 |
Source: Public Records
Tax History
| Year | Tax Paid | Tax Assessment Tax Assessment Total Assessment is a certain percentage of the fair market value that is determined by local assessors to be the total taxable value of land and additions on the property. | Land | Improvement |
|---|---|---|---|---|
| 2024 | $404 | $8,430 | $1,360 | $7,070 |
| 2023 | $404 | $8,430 | $1,360 | $7,070 |
| 2022 | $300 | $5,250 | $1,240 | $4,010 |
| 2021 | $302 | $5,250 | $1,240 | $4,010 |
| 2020 | $309 | $5,250 | $1,240 | $4,010 |
| 2019 | $342 | $5,250 | $1,240 | $4,010 |
| 2018 | $338 | $5,250 | $1,240 | $4,010 |
| 2017 | $280 | $5,250 | $1,240 | $4,010 |
| 2016 | $231 | $3,580 | $1,960 | $1,620 |
| 2015 | $221 | $3,580 | $1,960 | $1,620 |
| 2014 | $218 | $3,580 | $1,960 | $1,620 |
| 2012 | $88 | $3,760 | $2,060 | $1,700 |
Source: Public Records
Map
Nearby Homes
- 0 Voegele Ave Unit Lot 6048, 6049, 6
- 368 W 6th St
- 701 Springmill St
- 524 Lida St
- 212 Penn Ave
- 516 Burns St
- 580 N Mulberry St
- 118 Raymond Ave
- 0 Grant Rd Unit 5190994
- 230 Rae Ave
- 10 Gray Ct
- 81 Penn Ave
- 458 W West Dickson Ave
- 572 France St
- 492 Stark St
- 0 State Route 314 Unit 9069650
- 0 Lemley Ave Unit 9070540
- 688 Mcpherson St
- 30 Douglas Ave
- 31 Bartley Ave
Your Personal Tour Guide
Ask me questions while you tour the home.