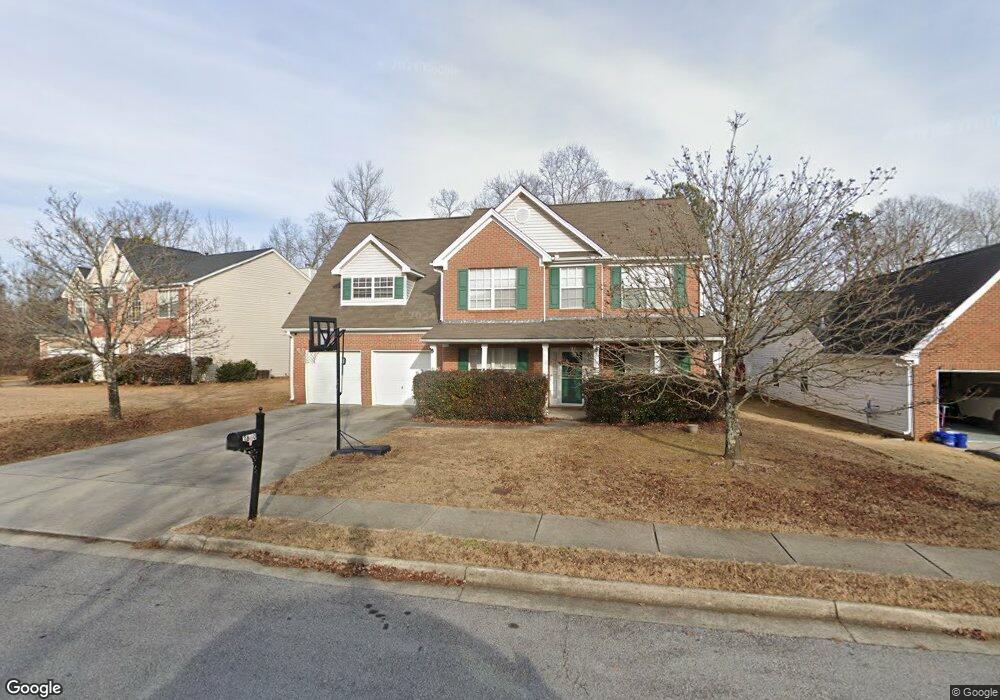
3680 Crescent Walk Ln NE Suwanee, GA 30024
Estimated Value: $527,053 - $557,000
4
Beds
3
Baths
2,861
Sq Ft
$188/Sq Ft
Est. Value
About This Home
This home is located at 3680 Crescent Walk Ln NE, Suwanee, GA 30024 and is currently estimated at $537,263, approximately $187 per square foot. 3680 Crescent Walk Ln NE is a home located in Gwinnett County with nearby schools including North Gwinnett Middle School, North Gwinnett High School, and Old Suwanee Christian School.
Ownership History
Date
Name
Owned For
Owner Type
Purchase Details
Closed on
Sep 16, 2022
Sold by
Lin Yansai
Bought by
3255 Wang 3680 & 367 Llc
Current Estimated Value
Purchase Details
Closed on
Jan 28, 2020
Sold by
Bhavnani Sanjeev K
Bought by
Wang Jinshun and Lin Yansai
Home Financials for this Owner
Home Financials are based on the most recent Mortgage that was taken out on this home.
Original Mortgage
$224,200
Interest Rate
3.72%
Mortgage Type
New Conventional
Purchase Details
Closed on
May 11, 2017
Sold by
Mize Melanie
Bought by
Bhavnani Sanjeev K and Bhavnani Sangeeta S
Purchase Details
Closed on
Jun 8, 2009
Sold by
Mize Melanie
Bought by
Mize Randy and Mize Melanie
Home Financials for this Owner
Home Financials are based on the most recent Mortgage that was taken out on this home.
Original Mortgage
$185,948
Interest Rate
5.27%
Mortgage Type
FHA
Purchase Details
Closed on
Aug 16, 2002
Sold by
Winmark Homes Inc
Bought by
Vanover Melanie A
Home Financials for this Owner
Home Financials are based on the most recent Mortgage that was taken out on this home.
Original Mortgage
$173,300
Interest Rate
6.49%
Mortgage Type
FHA
Create a Home Valuation Report for This Property
The Home Valuation Report is an in-depth analysis detailing your home's value as well as a comparison with similar homes in the area
Home Values in the Area
Average Home Value in this Area
Purchase History
| Date | Buyer | Sale Price | Title Company |
|---|---|---|---|
| 3255 Wang 3680 & 367 Llc | -- | -- | |
| Wang Jinshun | $299,000 | -- | |
| Bhavnani Sanjeev K | $260,000 | -- | |
| Mize Randy | -- | -- | |
| Vanover Melanie A | $176,100 | -- |
Source: Public Records
Mortgage History
| Date | Status | Borrower | Loan Amount |
|---|---|---|---|
| Previous Owner | Wang Jinshun | $224,200 | |
| Previous Owner | Mize Randy | $185,948 | |
| Previous Owner | Vanover Melanie A | $173,300 |
Source: Public Records
Tax History Compared to Growth
Tax History
| Year | Tax Paid | Tax Assessment Tax Assessment Total Assessment is a certain percentage of the fair market value that is determined by local assessors to be the total taxable value of land and additions on the property. | Land | Improvement |
|---|---|---|---|---|
| 2025 | $8,011 | $218,120 | $38,000 | $180,120 |
| 2024 | $7,892 | $212,280 | $33,600 | $178,680 |
| 2023 | $7,892 | $204,440 | $33,600 | $170,840 |
| 2022 | $6,718 | $179,880 | $33,600 | $146,280 |
| 2021 | $4,648 | $119,600 | $23,160 | $96,440 |
| 2020 | $4,794 | $122,880 | $23,160 | $99,720 |
| 2019 | $4,617 | $122,880 | $23,160 | $99,720 |
| 2018 | $3,962 | $104,000 | $29,200 | $74,800 |
| 2016 | $3,267 | $99,520 | $24,800 | $74,720 |
| 2015 | $3,295 | $99,520 | $24,800 | $74,720 |
| 2014 | -- | $89,200 | $20,400 | $68,800 |
Source: Public Records
Map
Nearby Homes
- 3998 Oak Crossing Dr NE
- 3941 Oak Crossing Dr
- 3720 Crescent Walk Ln
- 3740 Crescent Walk Ln
- 4071 Woodward Walk Ln
- 4154 Hawking Dr
- 4450 Woodward Walk Ln
- 3805 Roxwood Park Dr Unit 1
- 665 Roxford Ln Unit 3
- 3929 Two Bridge Dr
- 4217 Heisenberg Ln
- 4310 Woodward Walk Ln
- 957 Pont Du Gard Ct
- 3725 Roxwood Park Dr Unit 1
- 3720 Brookefall Landing
- 358 Rhodes House Ct
- 3612 Brookefall Ct
- 812 Holly Meadow Dr
- 3680 Crescent Walk Ln
- 3670 Crescent Walk Ln
- 3700 Crescent Walk Ln
- 3685 Crescent Walk Ln
- 3695 Crescent Walk Ln
- 3660 Crescent Walk Ln NE
- 3675 Crescent Walk Ln NE
- 3942 Alexandra Oak Ct
- 3660 Crescent Walk Ln
- 3705 Crescent Walk Ln
- 3675 Crescent Walk Ln Unit .
- 3952 Alexandra Oak Ct
- 3710 Crescent Walk Ln
- 3655 Crescent Walk Ln NE
- 3665 Crescent Walk Ln
- 3932 Alexandra Oak Ct
- 3715 Crescent Walk Ln
- 3655 Crescent Walk Ln
- 3922 Alexandra Oak Ct
- 3961 Oak Crossing Dr