3680 Lindsy Brooke Ct Unit 248 Douglasville, GA 30135
Lithia Springs NeighborhoodEstimated Value: $469,186 - $610,000
6
Beds
4
Baths
3,873
Sq Ft
$137/Sq Ft
Est. Value
About This Home
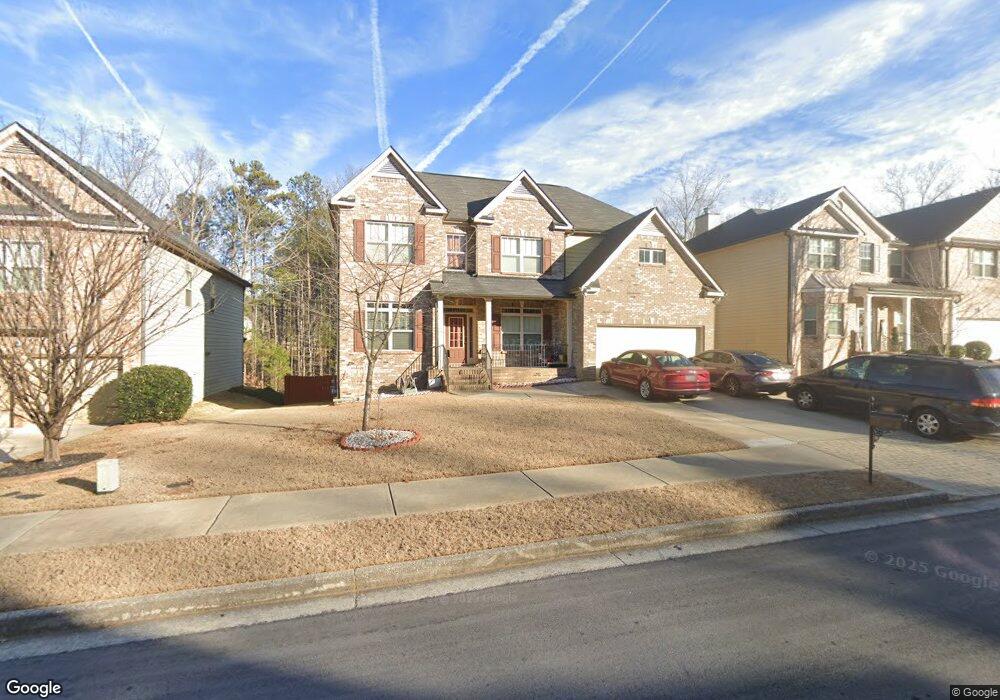
This home is located at 3680 Lindsy Brooke Ct Unit 248, Douglasville, GA 30135 and is currently estimated at $530,797, approximately $137 per square foot. 3680 Lindsy Brooke Ct Unit 248 is a home located in Douglas County with nearby schools including New Manchester Elementary School, Factory Shoals Middle School, and New Manchester High School.
Ownership History
Date
Name
Owned For
Owner Type
Purchase Details
Closed on
Apr 28, 2023
Sold by
Patel Rameshlal C
Bought by
Patel Rameshlal C and Patel Induben R
Current Estimated Value
Purchase Details
Closed on
Aug 14, 2014
Sold by
Patel Kalpeshkumar R
Bought by
Patel Rameshlal C
Purchase Details
Closed on
Jun 6, 2014
Sold by
Patel Kalpeshkumar
Bought by
Patel Kalpeshkumar R and Patel Rameshlal C
Purchase Details
Closed on
Nov 5, 2012
Sold by
Bk Residential Ventures Ll
Bought by
Bk Residential Construction Ll
Home Financials for this Owner
Home Financials are based on the most recent Mortgage that was taken out on this home.
Original Mortgage
$542,250
Interest Rate
3.4%
Mortgage Type
New Conventional
Purchase Details
Closed on
Aug 20, 2012
Sold by
Quality Properties Asset M
Bought by
Bk Residential Ventures Llc
Create a Home Valuation Report for This Property
The Home Valuation Report is an in-depth analysis detailing your home's value as well as a comparison with similar homes in the area
Home Values in the Area
Average Home Value in this Area
Purchase History
| Date | Buyer | Sale Price | Title Company |
|---|---|---|---|
| Patel Rameshlal C | -- | None Listed On Document | |
| Patel Rameshlal C | -- | -- | |
| Patel Kalpeshkumar R | -- | -- | |
| Patel Kalpeshkumar R | $260,000 | -- | |
| Bk Residential Construction Ll | $30,000 | -- | |
| Bk Residential Ventures Llc | $170,000 | -- |
Source: Public Records
Mortgage History
| Date | Status | Borrower | Loan Amount |
|---|---|---|---|
| Previous Owner | Bk Residential Construction Ll | $542,250 |
Source: Public Records
Tax History Compared to Growth
Tax History
| Year | Tax Paid | Tax Assessment Tax Assessment Total Assessment is a certain percentage of the fair market value that is determined by local assessors to be the total taxable value of land and additions on the property. | Land | Improvement |
|---|---|---|---|---|
| 2024 | $1,310 | $184,560 | $16,000 | $168,560 |
| 2023 | $1,310 | $161,800 | $16,000 | $145,800 |
| 2022 | $1,387 | $161,800 | $16,000 | $145,800 |
| 2021 | $1,387 | $129,760 | $14,080 | $115,680 |
| 2020 | $4,012 | $129,760 | $14,080 | $115,680 |
| 2019 | $3,717 | $126,520 | $14,080 | $112,440 |
| 2018 | $3,665 | $123,120 | $14,080 | $109,040 |
| 2017 | $3,584 | $111,240 | $14,080 | $97,160 |
| 2016 | $3,532 | $107,720 | $14,240 | $93,480 |
| 2015 | $3,345 | $101,880 | $14,880 | $87,000 |
| 2014 | $3,345 | $97,880 | $15,200 | $82,680 |
| 2013 | -- | $28,520 | $8,080 | $20,440 |
Source: Public Records
Map
Nearby Homes
- Reynold Plan at Palmer Falls
- 3664 Thornhill Ct
- 3760 Lindsy Brooke Ct
- 3677 Thornhill Ct
- 3687 Thornhill Ct
- Somerset III Plan at Palmer Falls
- 2070 Woodmont Dr
- 3540 Lindsy Brooke Ct
- 3544 Palmer Falls Dr
- 2306 Old Lower River Rd
- 3609 King Dr
- 2425 River Place Crossing
- 3944 Fairburn Rd
- 3990 Ridgeland Dr
- 3243 Bakewell St
- LOT 16 Hillside Ln
- LOT 5 Hillside Ln
- 3990 Pine Hill Dr
- 3680 Lindsy Brooke Ct
- 3670 Lindsy Brooke Ct
- 3690 Lindsy Brooke Ct
- 0 Lindsy Brooke Ct Unit 8602987
- 0 Lindsy Brooke Ct Unit 8590653
- 0 Lindsy Brooke Ct Unit 8375450
- 0 Lindsy Brooke Ct Unit 3237152
- 0 Lindsy Brooke Ct Unit 8729853
- 0 Lindsy Brooke Ct Unit 8708754
- 0 Lindsy Brooke Ct Unit 8661429
- 0 Lindsy Brooke Ct Unit 8390384
- 0 Lindsy Brooke Ct Unit 8255999
- 0 Lindsy Brooke Ct Unit 8729864
- 0 Lindsy Brooke Ct Unit 8729901
- 0 Lindsy Brooke Ct Unit 8708756
- 0 Lindsy Brooke Ct Unit 8708748
- 0 Lindsy Brooke Ct Unit 8229497
- 0 Lindsy Brooke Ct Unit 8771037
- 0 Lindsy Brooke Ct Unit 7024052
- 0 Lindsy Brooke Ct Unit 8987128