Estimated Value: $150,920 - $175,000
2
Beds
1
Bath
752
Sq Ft
$211/Sq Ft
Est. Value
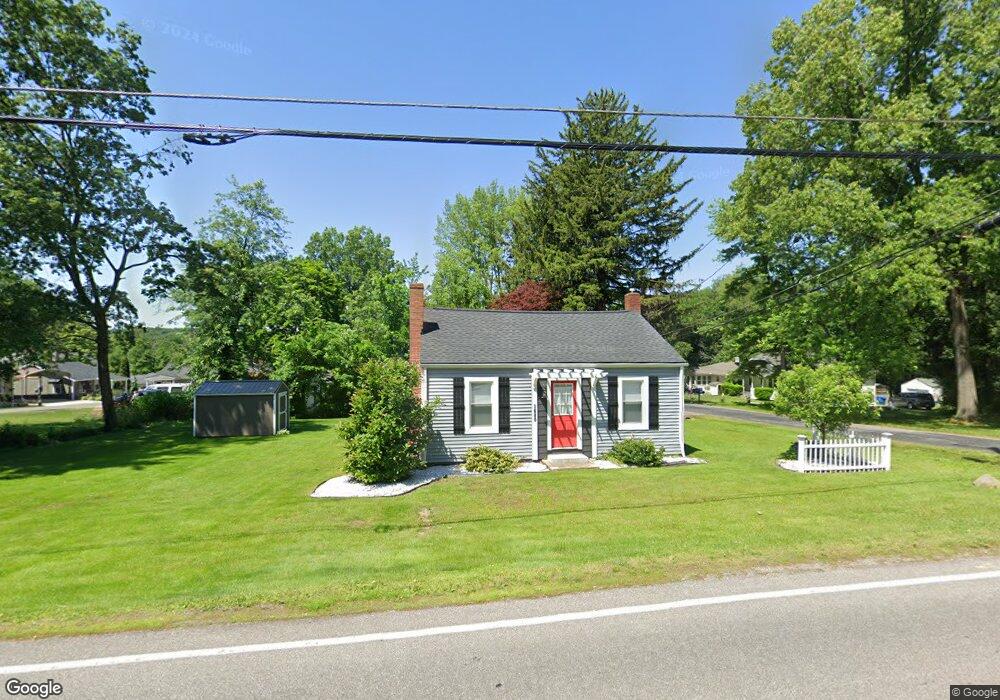
About This Home
This home is located at 3680 S Turkeyfoot Rd, Akron, OH 44319 and is currently estimated at $158,730, approximately $211 per square foot. 3680 S Turkeyfoot Rd is a home located in Summit County with nearby schools including St. Francis de Sales School and Academy of the Immaculate Heart of Mary.
Ownership History
Date
Name
Owned For
Owner Type
Purchase Details
Closed on
Jul 29, 2020
Sold by
Cravens John K and Cravens Karen
Bought by
Pataki Becky M
Current Estimated Value
Home Financials for this Owner
Home Financials are based on the most recent Mortgage that was taken out on this home.
Original Mortgage
$88,000
Outstanding Balance
$78,206
Interest Rate
3.1%
Mortgage Type
New Conventional
Estimated Equity
$80,524
Purchase Details
Closed on
May 28, 2020
Sold by
Skaroupka Timothy
Bought by
Cravens John K and Cravens Karen
Purchase Details
Closed on
Apr 6, 2019
Sold by
Chrisman Dorothy and Chrisman Michael
Bought by
Skaroupka Timothy
Purchase Details
Closed on
Mar 18, 2018
Sold by
Chrisman Dorothy
Bought by
Chrisman Dorothy and Chrisman Michael
Purchase Details
Closed on
Mar 4, 2016
Sold by
Postek Richard and Seal Mary E
Bought by
Chrisman Dorothy
Create a Home Valuation Report for This Property
The Home Valuation Report is an in-depth analysis detailing your home's value as well as a comparison with similar homes in the area
Home Values in the Area
Average Home Value in this Area
Purchase History
| Date | Buyer | Sale Price | Title Company |
|---|---|---|---|
| Pataki Becky M | $110,000 | First Security Title | |
| Cravens John K | $90,000 | First Security Title Corp | |
| Skaroupka Timothy | $20,000 | None Available | |
| Chrisman Dorothy | -- | None Available | |
| Chrisman Dorothy | $12,000 | None Available |
Source: Public Records
Mortgage History
| Date | Status | Borrower | Loan Amount |
|---|---|---|---|
| Open | Pataki Becky M | $88,000 |
Source: Public Records
Tax History Compared to Growth
Tax History
| Year | Tax Paid | Tax Assessment Tax Assessment Total Assessment is a certain percentage of the fair market value that is determined by local assessors to be the total taxable value of land and additions on the property. | Land | Improvement |
|---|---|---|---|---|
| 2025 | $2,651 | $44,923 | $9,902 | $35,021 |
| 2024 | $2,651 | $44,923 | $9,902 | $35,021 |
| 2023 | $2,651 | $44,923 | $9,902 | $35,021 |
| 2022 | $2,201 | $30,622 | $6,692 | $23,930 |
| 2021 | $2,075 | $30,622 | $6,692 | $23,930 |
| 2020 | $1,764 | $26,070 | $6,690 | $19,380 |
| 2019 | $1,482 | $19,790 | $6,690 | $13,100 |
| 2018 | $1,469 | $19,790 | $6,690 | $13,100 |
| 2017 | $1,277 | $19,790 | $6,690 | $13,100 |
| 2016 | $837 | $19,790 | $6,690 | $13,100 |
| 2015 | $1,277 | $19,790 | $6,690 | $13,100 |
| 2014 | $818 | $19,790 | $6,690 | $13,100 |
| 2013 | $732 | $18,590 | $6,690 | $11,900 |
Source: Public Records
Map
Nearby Homes
- 268 E Willowview Dr
- 441 Dorwil Dr
- 265 E Pace Ave
- 3803 Bay Path Dr
- 3809 Butterfield Dr
- 221 Lake Front Dr
- 552 Saunders Ave
- 428 Canova Dr
- TBD Heron Watch Dr
- 4131 State Park Dr
- 4216 State Rd
- 0 Sandy Beach Dr
- 4135 State Park Dr
- 72 Weil Ave
- 0 S Main St
- 206 Lakota Ave
- 3785 S Main St
- 0 W Turkeyfoot Lake Rd Unit 5157637
- 796 Portage Lakes Dr
- 802 Portage Lakes Dr
- 402 W Willowview Dr
- 405 W Rhine Ave
- 407 W Willowview Dr
- 3685 S Turkeyfoot Rd
- 398 W Rhine Ave
- 420 W Willowview Dr
- 411 W Willowview Dr
- 404 W Rhine Ave
- 372 E Willowview Dr
- 423 W Pace Ave
- 3699 S Turkeyfoot Rd
- 417 W Rhine Ave
- 430 W Willowview Dr
- 427 W Pace Ave
- 423 W Willowview Dr
- 433 W Pace Ave
- 364 E Willowview Dr
- 0 W Willowview Dr
- 418 W Pace Ave
- 3714 S Turkeyfoot Rd