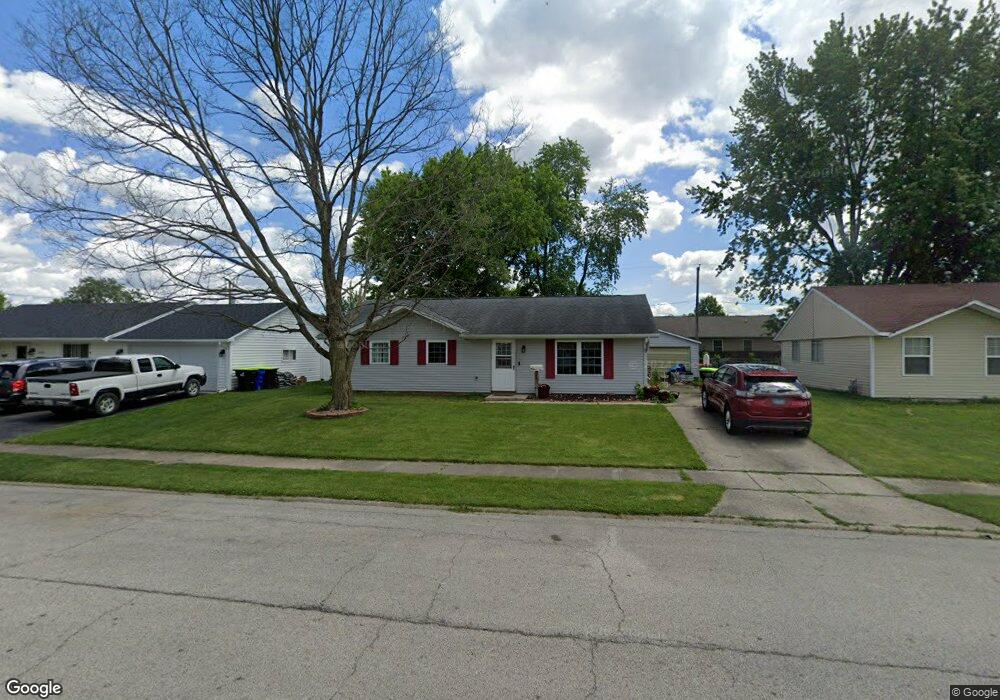
3681 Fontenac Dr Decatur, IL 62521
Greenlake NeighborhoodEstimated Value: $156,000 - $161,000
--
Bed
--
Bath
1,532
Sq Ft
$103/Sq Ft
Est. Value
About This Home
This home is located at 3681 Fontenac Dr, Decatur, IL 62521 and is currently estimated at $158,373, approximately $103 per square foot. 3681 Fontenac Dr is a home located in Macon County with nearby schools including McGaughey Elementary School, Mt. Zion Elementary School, and Mt. Zion Intermediate School.
Ownership History
Date
Name
Owned For
Owner Type
Purchase Details
Closed on
Jun 15, 2012
Sold by
Clearwater Shores Development Llc
Bought by
Kent Pope Builders Llc
Current Estimated Value
Purchase Details
Closed on
Jun 25, 2005
Sold by
Mcelwee Rocklin D
Bought by
Mcelwee Brenda L
Purchase Details
Closed on
Jan 13, 1992
Sold by
Jackson Theodore W and Jackson Margaret R
Bought by
Mcelwee Rocklin D and Mcelwee Brenda L
Home Financials for this Owner
Home Financials are based on the most recent Mortgage that was taken out on this home.
Original Mortgage
$62,050
Interest Rate
5.75%
Mortgage Type
Credit Line Revolving
Purchase Details
Closed on
Jan 1, 1992
Home Financials for this Owner
Home Financials are based on the most recent Mortgage that was taken out on this home.
Original Mortgage
$62,050
Interest Rate
5.75%
Mortgage Type
Credit Line Revolving
Create a Home Valuation Report for This Property
The Home Valuation Report is an in-depth analysis detailing your home's value as well as a comparison with similar homes in the area
Home Values in the Area
Average Home Value in this Area
Purchase History
| Date | Buyer | Sale Price | Title Company |
|---|---|---|---|
| Kent Pope Builders Llc | -- | None Available | |
| Mcelwee Brenda L | -- | None Available | |
| Mcelwee Rocklin D | $46,500 | None Available | |
| -- | $46,500 | -- |
Source: Public Records
Mortgage History
| Date | Status | Borrower | Loan Amount |
|---|---|---|---|
| Previous Owner | Mcelwee Rocklin D | $62,050 |
Source: Public Records
Tax History Compared to Growth
Tax History
| Year | Tax Paid | Tax Assessment Tax Assessment Total Assessment is a certain percentage of the fair market value that is determined by local assessors to be the total taxable value of land and additions on the property. | Land | Improvement |
|---|---|---|---|---|
| 2024 | $3,107 | $40,385 | $6,252 | $34,133 |
| 2023 | $2,957 | $37,525 | $5,809 | $31,716 |
| 2022 | $2,785 | $35,283 | $5,462 | $29,821 |
| 2021 | $2,690 | $33,449 | $5,178 | $28,271 |
| 2020 | $2,578 | $31,968 | $4,949 | $27,019 |
| 2019 | $2,578 | $31,968 | $4,949 | $27,019 |
| 2018 | $2,485 | $31,268 | $4,841 | $26,427 |
| 2017 | $2,458 | $30,882 | $4,781 | $26,101 |
| 2016 | $2,144 | $27,660 | $4,778 | $22,882 |
| 2015 | $2,072 | $27,305 | $4,717 | $22,588 |
| 2014 | $1,979 | $27,305 | $4,717 | $22,588 |
| 2013 | $1,988 | $27,305 | $4,717 | $22,588 |
Source: Public Records
Map
Nearby Homes
- 2488 S Fontaine Dr
- 2504 S Nantucket Dr
- 2554 S Nantucket Dr
- 2458 Quail Dr
- 2571 Lansdowne Dr
- 3405 Fontenac Ct
- 3290 E Fitzgerald Rd
- 3172 Redlich Dr
- 3552 E Orchard Dr
- 3210 Fields Ct
- 1968 S Baltimore Ave
- 3109 E Cherry Dr
- 1748 S Montrose Ave
- 3330 S Baltimore Ave
- 3645 E Fulton Ave
- 1745 S 44th St
- 1715 S 34th Place
- 1809 S 32nd St
- 4090 S Lake Ct
- 3254 E Fulton Ave
- 3669 Fontenac Dr
- 3707 Fontenac Dr
- 3680 Sydney Ct
- 3710 Sydney Ct
- 3657 Fontenac Dr
- 3735 Fontenac Dr
- 2481 S Baronette Ct
- 3660 Sydney Ct
- 3645 Fontenac Dr
- 3763 Fontenac Dr
- 3730 Sydney Ct
- 2472 S Baronette Ct
- 2460 S Baronette Ct
- 2465 S Baronette Ct
- LOT 14 Sydney Ct
- LOT 13 Sydney Ct
- 2476 S Marquette Ct
- 3685 Sydney Ct
- 3715 Sydney Ct
- 2464 S Marquette Ct