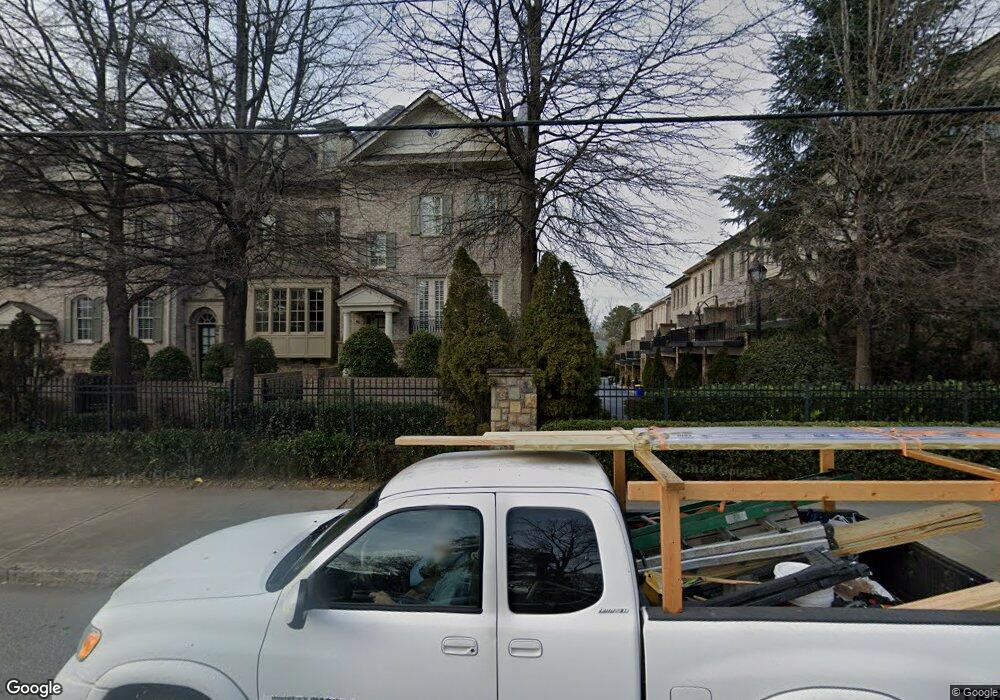
3681 Peachtree Rd NE Atlanta, GA 30319
Historic Brookhaven NeighborhoodEstimated Value: $821,000 - $1,034,005
4
Beds
4
Baths
2,765
Sq Ft
$331/Sq Ft
Est. Value
About This Home
This home is located at 3681 Peachtree Rd NE, Atlanta, GA 30319 and is currently estimated at $914,001, approximately $330 per square foot. 3681 Peachtree Rd NE is a home with nearby schools including Smith Elementary School, Sutton Middle School, and North Atlanta High School.
Ownership History
Date
Name
Owned For
Owner Type
Purchase Details
Closed on
Aug 23, 2018
Sold by
Yeosock Susan
Bought by
Kelly Dennis Walter and Kelly Deborah Wynne
Current Estimated Value
Home Financials for this Owner
Home Financials are based on the most recent Mortgage that was taken out on this home.
Original Mortgage
$300,000
Outstanding Balance
$260,538
Interest Rate
4.5%
Mortgage Type
New Conventional
Estimated Equity
$653,463
Purchase Details
Closed on
Jan 13, 2017
Sold by
Mccray Henry W
Bought by
Yeosock Susan
Purchase Details
Closed on
Feb 13, 2012
Sold by
Toland Lande
Bought by
Mccray Henry W and Mccray Elizabeth
Home Financials for this Owner
Home Financials are based on the most recent Mortgage that was taken out on this home.
Original Mortgage
$417,000
Interest Rate
3.91%
Mortgage Type
New Conventional
Purchase Details
Closed on
Dec 21, 2009
Sold by
John Willis Homes Inc
Bought by
Toland Lance
Create a Home Valuation Report for This Property
The Home Valuation Report is an in-depth analysis detailing your home's value as well as a comparison with similar homes in the area
Home Values in the Area
Average Home Value in this Area
Purchase History
| Date | Buyer | Sale Price | Title Company |
|---|---|---|---|
| Kelly Dennis Walter | $850,000 | -- | |
| Yeosock Susan | $750,000 | -- | |
| Mccray Henry W | $540,000 | -- | |
| Toland Lance | $525,000 | -- |
Source: Public Records
Mortgage History
| Date | Status | Borrower | Loan Amount |
|---|---|---|---|
| Open | Kelly Dennis Walter | $300,000 | |
| Previous Owner | Mccray Henry W | $417,000 |
Source: Public Records
Tax History Compared to Growth
Tax History
| Year | Tax Paid | Tax Assessment Tax Assessment Total Assessment is a certain percentage of the fair market value that is determined by local assessors to be the total taxable value of land and additions on the property. | Land | Improvement |
|---|---|---|---|---|
| 2025 | $8,238 | $332,840 | $64,480 | $268,360 |
| 2023 | $10,105 | $244,080 | $57,440 | $186,640 |
| 2022 | $8,139 | $244,080 | $57,440 | $186,640 |
| 2021 | $7,845 | $236,960 | $55,760 | $181,200 |
| 2020 | $8,888 | $260,320 | $43,720 | $216,600 |
| 2019 | $103 | $255,720 | $42,960 | $212,760 |
| 2018 | $10,504 | $300,000 | $39,680 | $260,320 |
| 2017 | $9,834 | $227,680 | $31,320 | $196,360 |
| 2016 | $9,859 | $227,680 | $31,320 | $196,360 |
| 2015 | $8,453 | $210,000 | $31,320 | $178,680 |
| 2014 | $9,262 | $204,280 | $28,120 | $176,160 |
Source: Public Records
Map
Nearby Homes
- 3676 Brookhaven Manor Crossing NE
- 3667 Peachtree Rd NE Unit 6
- 3667 Peachtree Rd NE Unit 13
- 3660 Peachtree Rd NE Unit 2H
- 3660 Peachtree Rd NE Unit 6
- 3660 Peachtree Rd NE Unit 5
- 3657 Peachtree Rd NE Unit 8A
- 3655 Peachtree Rd NE Unit 304
- 3655 Peachtree Rd NE Unit 401
- 3649 Peachtree Rd NE Unit 305
- 3648 Peachtree Rd Unit 4S
- 3685 Cantrell Rd NE
- 3734 Paige Way NE Unit 10
- 3585 Roxboro Rd NE Unit 2
- 3630 Peachtree Rd NE Unit 2404
- 3630 Peachtree Rd NE Unit 2104
- 3630 Peachtree Rd NE Unit 3106
- 3630 Peachtree Rd NE Unit 2106
- 3630 Peachtree Rd NE Unit 2009
- 3630 Peachtree Rd NE Unit 2102
- 3681 Brookhaven Manor Crossing NE
- 3681 Brookhaven Manor Crossing NE Unit 33
- 3679 Brookhaven Manor Crossing NE Unit 32
- 3677 Brookhaven Manor Crossing NE
- 3677 Brookhaven Manor Crossing NE Unit 3677
- 3677 Brookhaven Manor Crossing NE Unit 31
- 3701 Manor Brook Ct NE Unit 24
- 3703 Manor Brook Ct NE
- 3703 Manor Brook Ct NE Unit 3703
- 3703 Manor Brook Ct NE Unit 23
- 3675 Peachtree St Unit 45
- 3675 Peachtree Rd NE Unit 31
- 3675 Peachtree Rd NE Unit 5
- 3675 Peachtree Rd NE Unit 5
- 3675 Peachtree Rd NE Unit 58
- 3675 Peachtree Rd NE Unit 57
- 3675 Peachtree Rd NE Unit 56
- 3675 Peachtree Rd NE Unit 55
- 3675 Peachtree Rd NE Unit 54