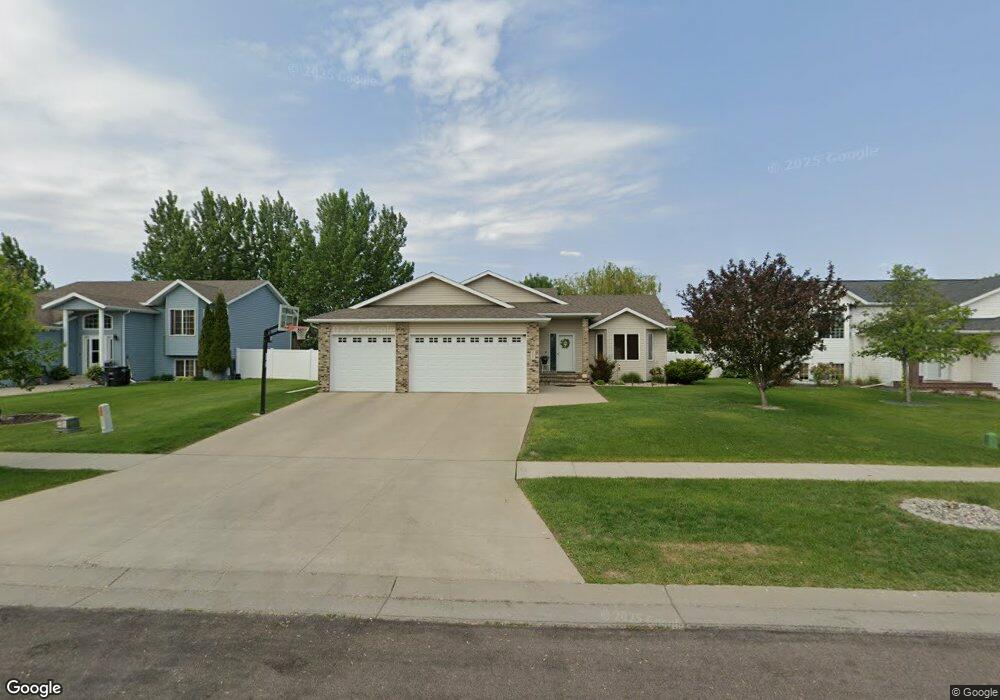
3683 Harrison St S Fargo, ND 58104
Pointe West NeighborhoodEstimated Value: $379,498 - $418,000
2
Beds
2
Baths
1,290
Sq Ft
$310/Sq Ft
Est. Value
About This Home
This home is located at 3683 Harrison St S, Fargo, ND 58104 and is currently estimated at $400,375, approximately $310 per square foot. 3683 Harrison St S is a home located in Cass County with nearby schools including Kennedy Elementary School, Discovery Middle School, and Fargo Davies High School.
Ownership History
Date
Name
Owned For
Owner Type
Purchase Details
Closed on
Jan 11, 2013
Sold by
Johnson James F
Bought by
Johnson James F and Hanson Elizabeth A
Current Estimated Value
Purchase Details
Closed on
Jan 8, 2009
Sold by
Lang Adrin W
Bought by
Spanier Elska M and Spanier Adam K
Home Financials for this Owner
Home Financials are based on the most recent Mortgage that was taken out on this home.
Original Mortgage
$208,160
Interest Rate
4.87%
Mortgage Type
FHA
Purchase Details
Closed on
May 25, 2007
Sold by
Bachmeier Custom Homes Inc
Bought by
Lang Darin W
Home Financials for this Owner
Home Financials are based on the most recent Mortgage that was taken out on this home.
Original Mortgage
$155,160
Interest Rate
6.22%
Mortgage Type
New Conventional
Purchase Details
Closed on
May 24, 2007
Sold by
Matrix Properties Corp
Bought by
Bachmeier Custom Homes Inc
Home Financials for this Owner
Home Financials are based on the most recent Mortgage that was taken out on this home.
Original Mortgage
$155,160
Interest Rate
6.22%
Mortgage Type
New Conventional
Create a Home Valuation Report for This Property
The Home Valuation Report is an in-depth analysis detailing your home's value as well as a comparison with similar homes in the area
Home Values in the Area
Average Home Value in this Area
Purchase History
| Date | Buyer | Sale Price | Title Company |
|---|---|---|---|
| Johnson James F | -- | Fm Title | |
| Spanier Elska M | $212,000 | -- | |
| Lang Darin W | -- | -- | |
| Bachmeier Custom Homes Inc | -- | -- |
Source: Public Records
Mortgage History
| Date | Status | Borrower | Loan Amount |
|---|---|---|---|
| Previous Owner | Spanier Elska M | $208,160 | |
| Previous Owner | Lang Darin W | $155,160 |
Source: Public Records
Tax History Compared to Growth
Tax History
| Year | Tax Paid | Tax Assessment Tax Assessment Total Assessment is a certain percentage of the fair market value that is determined by local assessors to be the total taxable value of land and additions on the property. | Land | Improvement |
|---|---|---|---|---|
| 2024 | $6,144 | $180,250 | $36,700 | $143,550 |
| 2023 | $6,668 | $182,900 | $38,300 | $144,600 |
| 2022 | $6,306 | $166,250 | $38,300 | $127,950 |
| 2021 | $6,272 | $160,650 | $38,300 | $122,350 |
| 2020 | $5,958 | $150,150 | $38,300 | $111,850 |
| 2019 | $5,963 | $150,150 | $23,950 | $126,200 |
| 2018 | $5,907 | $150,150 | $23,950 | $126,200 |
| 2017 | $5,675 | $142,450 | $23,950 | $118,500 |
| 2016 | $5,067 | $129,500 | $23,950 | $105,550 |
| 2015 | $5,380 | $129,500 | $16,300 | $113,200 |
| 2014 | $5,223 | $121,400 | $16,300 | $105,100 |
| 2013 | $5,134 | $115,600 | $16,300 | $99,300 |
Source: Public Records
Map
Nearby Homes
- 4306 39th Ave S
- 4293 39 1 2 Ave S
- 4274 39 1 2 Ave S
- 4276 39 1 2 Ave S
- 4318 39 1 2 Ave S
- 4216 34th Ave S
- 4176 Arthur Dr
- 4168 Arthur Dr
- 4245 Coventry Dr S
- 4150 Arthur Dr
- 4106 Arthur Dr
- 3606 Decorah Way S
- 3630 Decorah Way S
- 3624 Decorah Way
- 3612 Decorah Way S
- 4801 Decorah Way S
- 1665 3-Stall Plan at The Residence at Valley View Estates
- 4824 Decorah Way S
- 4849 Decorah Way S
- 3712 49th St S
- 3697 Harrison St S
- 3671 Harrison St S
- 3686 Polk St S
- 3674 Polk St S
- 3696 Polk St S
- 3655 Harrison St S
- 3709 Harrison St S
- 3664 Polk St S
- 3714 Polk St S
- 3682 Harrison St S
- 3684 Harrison St S
- 3672 Harrison St S
- 3694 Harrison St S
- 3696 Harrison St S
- 3647 Harrison St S
- 3737 Harrison St S
- 3660 Harrison St S
- 3654 Polk St S
- 3658 Harrison St S
- 3738 Polk St S