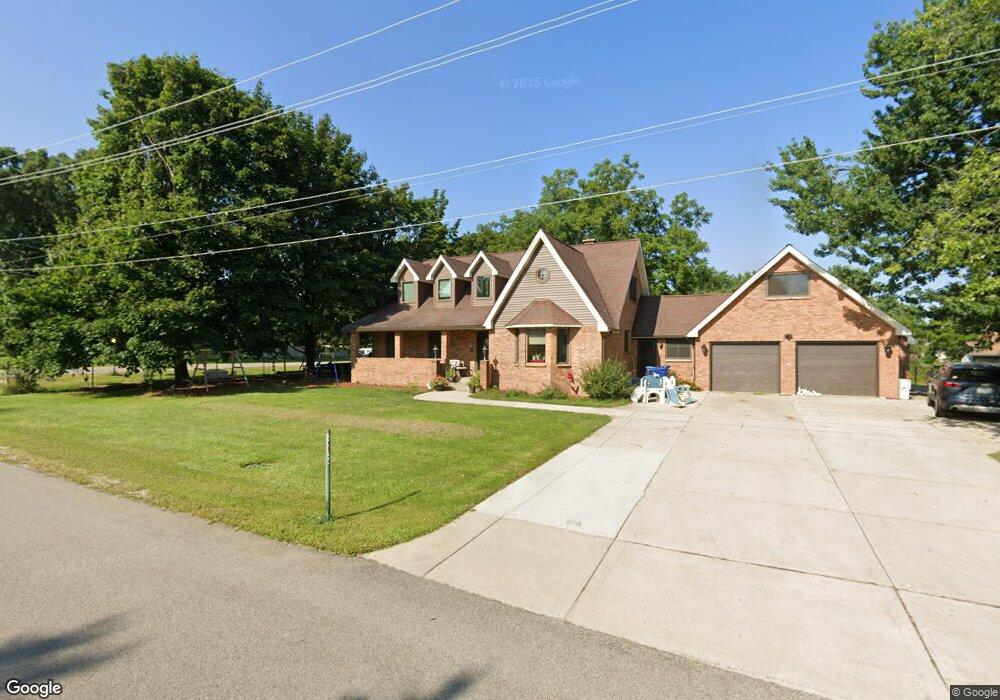
36834 N Boulevard View Ave Waukegan, IL 60087
Estimated Value: $372,000 - $409,000
--
Bed
3
Baths
1,947
Sq Ft
$202/Sq Ft
Est. Value
About This Home
This home is located at 36834 N Boulevard View Ave, Waukegan, IL 60087 and is currently estimated at $393,447, approximately $202 per square foot. 36834 N Boulevard View Ave is a home located in Lake County with nearby schools including Oakdale Elementary School, Jack Benny Middle School, and Waukegan High School.
Ownership History
Date
Name
Owned For
Owner Type
Purchase Details
Closed on
Nov 20, 2019
Sold by
Teigland Carole B and Teigland Linda L
Bought by
Teigland Linda L and Teigland Mark L
Current Estimated Value
Purchase Details
Closed on
Sep 11, 2019
Sold by
Teigland Carole B
Bought by
Teigland Carole B and Teigland Linda L
Purchase Details
Closed on
Jul 1, 2016
Sold by
Chicago Title Land Trust Company
Bought by
Teigland Carole B
Purchase Details
Closed on
Feb 12, 2004
Sold by
Teigland Carole
Bought by
Bank Of Waukegan and Trust #1205
Purchase Details
Closed on
Jun 13, 2001
Sold by
Bank Of Waukegan
Bought by
Teigland Carole
Home Financials for this Owner
Home Financials are based on the most recent Mortgage that was taken out on this home.
Original Mortgage
$130,000
Interest Rate
7.18%
Create a Home Valuation Report for This Property
The Home Valuation Report is an in-depth analysis detailing your home's value as well as a comparison with similar homes in the area
Home Values in the Area
Average Home Value in this Area
Purchase History
| Date | Buyer | Sale Price | Title Company |
|---|---|---|---|
| Teigland Linda L | -- | None Available | |
| Teigland Carole B | -- | None Available | |
| Teigland Carole B | -- | Chicago Title Land Trust Co | |
| Bank Of Waukegan | -- | -- | |
| Teigland Carole | -- | -- |
Source: Public Records
Mortgage History
| Date | Status | Borrower | Loan Amount |
|---|---|---|---|
| Previous Owner | Teigland Carole | $130,000 |
Source: Public Records
Tax History Compared to Growth
Tax History
| Year | Tax Paid | Tax Assessment Tax Assessment Total Assessment is a certain percentage of the fair market value that is determined by local assessors to be the total taxable value of land and additions on the property. | Land | Improvement |
|---|---|---|---|---|
| 2024 | $11,454 | $136,457 | $17,563 | $118,894 |
| 2023 | $10,165 | $126,689 | $16,306 | $110,383 |
| 2022 | $10,165 | $106,936 | $15,790 | $91,146 |
| 2021 | $9,245 | $102,645 | $15,156 | $87,489 |
| 2020 | $8,913 | $100,121 | $14,783 | $85,338 |
| 2019 | $8,305 | $97,214 | $14,354 | $82,860 |
| 2018 | $6,884 | $83,013 | $23,953 | $59,060 |
| 2017 | $6,878 | $80,635 | $23,267 | $57,368 |
| 2016 | $6,685 | $77,045 | $22,231 | $54,814 |
| 2015 | $6,456 | $73,070 | $21,084 | $51,986 |
| 2014 | $6,447 | $74,977 | $20,849 | $54,128 |
| 2012 | $7,060 | $75,552 | $21,009 | $54,543 |
Source: Public Records
Map
Nearby Homes
- 12535 W Blanchard Rd
- 13360 W Blanchard Rd
- 36245 N Green Bay Rd
- 13377 W Blanchard Rd
- 3032 W Vermont Ave
- 36955 N Garrick Ave
- 12933 W Polo Ave
- 3436 Florida Ave
- 2928 W Country Club Ave
- 3000 W Country Club Ave
- 2946 W Country Club Ave
- 0 Ryan Rd
- 2670 Woodview Ct Unit 1
- 4147 Continental Dr
- 2634 Woodview Ct Unit 5
- 12312 W Audrey Ave
- 2713 Varonen Ave
- 2708 Dana Ave
- 2705 Dana Ave
- 3627 Atlantic Ave
- 36856 N Boulevard View Ave
- 13196 W Nemesis Ave
- 36796 N Boulevard View Ave
- 2504 N Boulevard View Ave
- 3525 W Nemesis Ave
- 36857 N Boulevard View Ave
- 13170 W Wall Ave
- 36760 N Boulevard View Ave
- 3470 W Nemesis Ave
- 13192 W Wall Ave
- 13112 W Wall Ave
- 36797 N Belle Plaine Ave
- 2465 Belle Plaine Rd
- 13233 W Wall Ave
- 13155 W Tyler Ave
- 3460 W Nemesis Ave
- 13065 W Wall Ave
- 13220 W Wall Ave
- 12983, 12961 and 129 Nemesis Ave
- 36921 N Boulevard View Ave