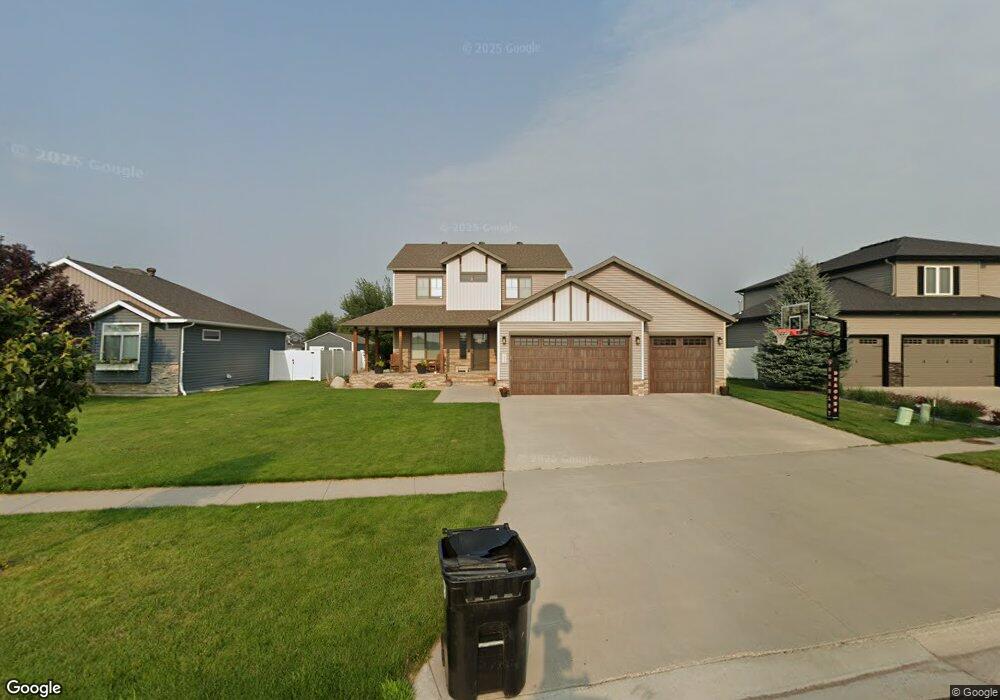
3685 54th St S Fargo, ND 58104
Brandt Crossing NeighborhoodEstimated Value: $560,874 - $655,000
4
Beds
4
Baths
3,276
Sq Ft
$184/Sq Ft
Est. Value
About This Home
This home is located at 3685 54th St S, Fargo, ND 58104 and is currently estimated at $603,219, approximately $184 per square foot. 3685 54th St S is a home located in Cass County with nearby schools including Liberty Middle School, West Fargo Sheyenne High School, and Trinity Elementary School.
Ownership History
Date
Name
Owned For
Owner Type
Purchase Details
Closed on
Jan 21, 2022
Sold by
Mcarthur Wayne J and Mcarthur Jo Stephanie
Bought by
Robertsdahl Kelly S
Current Estimated Value
Home Financials for this Owner
Home Financials are based on the most recent Mortgage that was taken out on this home.
Original Mortgage
$424,000
Outstanding Balance
$388,162
Interest Rate
3.22%
Mortgage Type
New Conventional
Estimated Equity
$215,057
Purchase Details
Closed on
Feb 13, 2015
Sold by
Gilbertson Harry and Gilbertson Jodi L
Bought by
Harry Gilbertson Construction Inc
Home Financials for this Owner
Home Financials are based on the most recent Mortgage that was taken out on this home.
Original Mortgage
$235,000
Interest Rate
3.66%
Mortgage Type
Construction
Purchase Details
Closed on
Oct 16, 2014
Sold by
K Square Developers Llc
Bought by
Gilbertson Gilbertson Harry Harry and Gilbertson Harry
Create a Home Valuation Report for This Property
The Home Valuation Report is an in-depth analysis detailing your home's value as well as a comparison with similar homes in the area
Home Values in the Area
Average Home Value in this Area
Purchase History
| Date | Buyer | Sale Price | Title Company |
|---|---|---|---|
| Robertsdahl Kelly S | -- | New Title Company Name | |
| Robertsdahl Kelly S | $530,000 | New Title Company Name | |
| Harry Gilbertson Construction Inc | -- | None Available | |
| Gilbertson Gilbertson Harry Harry | -- | Trn Abstract And Title |
Source: Public Records
Mortgage History
| Date | Status | Borrower | Loan Amount |
|---|---|---|---|
| Open | Robertsdahl Kelly S | $424,000 | |
| Closed | Robertsdahl Kelly S | $424,000 | |
| Previous Owner | Harry Gilbertson Construction Inc | $235,000 |
Source: Public Records
Tax History
| Year | Tax Paid | Tax Assessment Tax Assessment Total Assessment is a certain percentage of the fair market value that is determined by local assessors to be the total taxable value of land and additions on the property. | Land | Improvement |
|---|---|---|---|---|
| 2024 | $9,004 | $250,100 | $35,950 | $214,150 |
| 2023 | $9,810 | $267,400 | $37,600 | $229,800 |
| 2022 | $9,202 | $232,500 | $37,600 | $194,900 |
| 2021 | $8,856 | $222,500 | $37,600 | $184,900 |
| 2020 | $8,748 | $222,500 | $37,600 | $184,900 |
| 2019 | $8,710 | $222,500 | $23,500 | $199,000 |
| 2018 | $8,367 | $215,000 | $23,500 | $191,500 |
| 2017 | $6,316 | $133,450 | $23,500 | $109,950 |
| 2016 | $5,809 | $119,800 | $23,500 | $96,300 |
| 2015 | $1,969 | $11,200 | $11,200 | $0 |
| 2014 | $292 | $150 | $150 | $0 |
| 2013 | $5 | $100 | $100 | $0 |
Source: Public Records
Map
Nearby Homes
- 3644 54th St S
- 3665 Valley View Dr S
- 3609 Crimson Loop S
- 3700 Chinook Dr S
- 3686 Chinook Dr S
- 3724 49th St S
- 3707 Merrifield Dr S
- 4849 Decorah Way S
- 4824 Decorah Way S
- 4809 Decorah Way S
- 4801 Decorah Way S
- 4110 52nd St S
- 3630 Decorah Way S
- 3612 Decorah Way S
- 3624 Decorah Way
- 3606 Decorah Way S
- 3760 Merrifield Dr S
- 3796 Norman Ct S
- 9350 & 9124 57th St S
- 4773 Townsite Place S
- 3681 54th St S
- 3689 54th St S
- 3693 54th St S
- 3684 Valley View Dr S
- 3674 Valley View Dr S
- 3669 54th St S
- 3694 Valley View Dr S
- 3697 54th St S
- 3680 54th St S
- 3661 54th St S
- 3654 Valley View Dr S
- 3649 54th St S
- 3644 Valley View Dr S
- 3675 Valley View Dr S
- 3685 Valley View Dr S
- 3695 Valley View Dr S
- 3634 Valley View Dr S
- 3637 54th St S
- 5432 37th Ave S
- 5422 37th Ave S
Your Personal Tour Guide
Ask me questions while you tour the home.