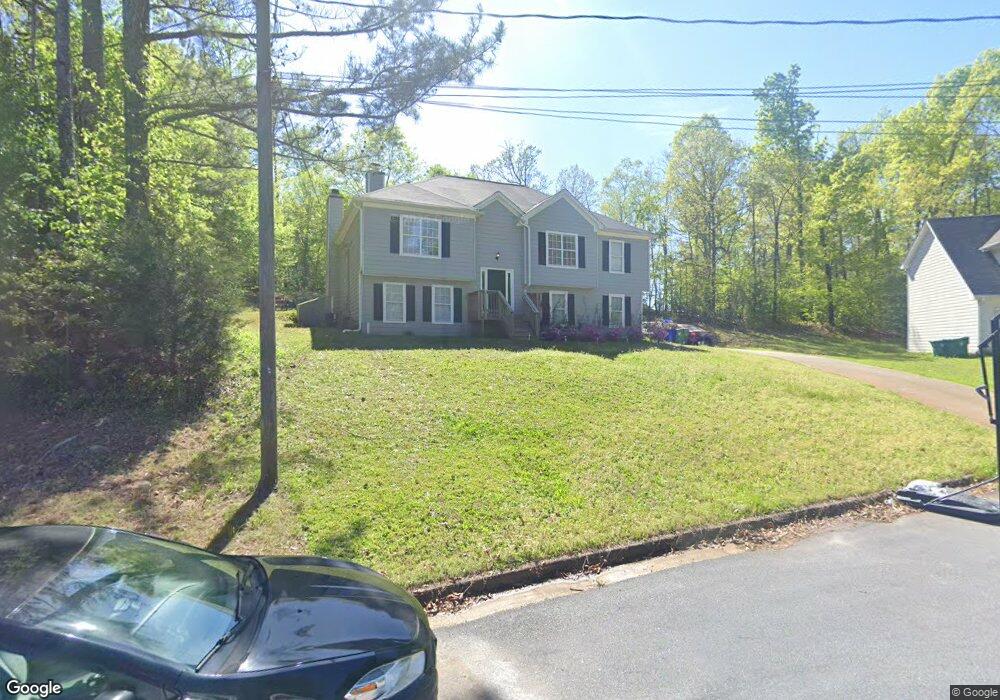
3685 Hollow Oak Ln Lithonia, GA 30038
Estimated Value: $282,000 - $310,000
4
Beds
3
Baths
2,372
Sq Ft
$125/Sq Ft
Est. Value
About This Home
This home is located at 3685 Hollow Oak Ln, Lithonia, GA 30038 and is currently estimated at $296,494, approximately $124 per square foot. 3685 Hollow Oak Ln is a home located in DeKalb County with nearby schools including Browns Mill Elementary School, Salem Middle School, and Martin Luther King- Jr. High School.
Ownership History
Date
Name
Owned For
Owner Type
Purchase Details
Closed on
Jan 2, 2013
Sold by
Bailey Courtney A
Bought by
The Georgia Lp
Current Estimated Value
Purchase Details
Closed on
May 23, 2007
Sold by
Hud-Housing Of Urban Dev
Bought by
Bailey Courtney A
Home Financials for this Owner
Home Financials are based on the most recent Mortgage that was taken out on this home.
Original Mortgage
$111,150
Interest Rate
6.17%
Purchase Details
Closed on
Dec 2, 2003
Sold by
Washington Mutual Bank Fa
Bought by
Hud
Purchase Details
Closed on
Nov 14, 2001
Sold by
Hernandez Ranti
Bought by
Terry Carolyn D
Home Financials for this Owner
Home Financials are based on the most recent Mortgage that was taken out on this home.
Original Mortgage
$162,450
Interest Rate
6.49%
Mortgage Type
FHA
Purchase Details
Closed on
May 31, 1995
Sold by
Legecy Homes Inc
Bought by
Hernandez Ranti
Create a Home Valuation Report for This Property
The Home Valuation Report is an in-depth analysis detailing your home's value as well as a comparison with similar homes in the area
Home Values in the Area
Average Home Value in this Area
Purchase History
| Date | Buyer | Sale Price | Title Company |
|---|---|---|---|
| The Georgia Lp | $68,001 | -- | |
| Bailey Courtney A | -- | -- | |
| Hud | -- | -- | |
| Washington Mutual Bank Fa | $169,574 | -- | |
| Terry Carolyn D | $165,000 | -- | |
| Hernandez Ranti | $124,900 | -- | |
| Legacy Homes Inc | $16,000 | -- |
Source: Public Records
Mortgage History
| Date | Status | Borrower | Loan Amount |
|---|---|---|---|
| Previous Owner | Bailey Courtney A | $111,150 | |
| Previous Owner | Terry Carolyn D | $162,450 | |
| Closed | Legacy Homes Inc | $0 |
Source: Public Records
Tax History Compared to Growth
Tax History
| Year | Tax Paid | Tax Assessment Tax Assessment Total Assessment is a certain percentage of the fair market value that is determined by local assessors to be the total taxable value of land and additions on the property. | Land | Improvement |
|---|---|---|---|---|
| 2025 | $5,243 | $109,600 | $15,200 | $94,400 |
| 2024 | $5,242 | $109,600 | $15,200 | $94,400 |
| 2023 | $5,242 | $71,348 | $8,562 | $62,786 |
| 2022 | $4,961 | $71,348 | $8,562 | $62,786 |
| 2021 | $3,128 | $76,200 | $9,480 | $66,720 |
| 2020 | $3,128 | $63,440 | $9,480 | $53,960 |
| 2019 | $2,781 | $55,520 | $9,480 | $46,040 |
| 2018 | $2,278 | $61,520 | $9,480 | $52,040 |
| 2017 | $2,178 | $41,600 | $6,520 | $35,080 |
| 2016 | $2,182 | $41,600 | $6,520 | $35,080 |
| 2014 | $1,525 | $26,080 | $24,640 | $1,440 |
Source: Public Records
Map
Nearby Homes
- 3631 Raiders Ridge Dr
- 4461 Dogwood Farms Dr
- 3774 Hollow Oak Ln
- 3711 Meadow Vista Trail
- 4586 High Gate Ln
- 4596 Meadow Creek Path Unit II
- 4517 Meadow Vista Trace Unit 2
- 4543 Red Tail Dr
- 3724 Eagles Beek Cir Unit 1
- 3778 Berdon Ln
- 3945 Glen Park Dr
- 3688 Eagles Beek Cir
- 4590 Blue Sky Ct
- 4305 Old Lake Dr
- 4301 Dogwood Farms Dr
- 4734 Eagles Ridge Loop
- 4263 Southvale Dr
- 4299 Wesleyan Point
- 3745 Londonderry Ct
- 4382 Oakleaf Cove
- 3661 Woodyhill Dr
- 3679 Hollow Oak Ln
- 4391 Meadow Vista Dr Unit 2
- 3669 Woodyhill Dr
- 4387 Meadow Vista Dr
- 3698 Hollow Oak Ln
- 3686 Hollow Oak Ln
- 3680 Hollow Oak Ln
- 4381 Meadow Vista Dr
- 3675 Woodyhill Dr
- 4395 Meadow Vista Dr Unit 2
- 3704 Hollow Oak Ln
- 3670 Woodyhill Dr
- 3712 Hollow Oak Ln
- 4388 Meadow Vista Dr
- 4392 Meadow Vista Dr Unit 2/148
- 4392 Meadow Vista Dr Unit 2
- 3685 Woodyhill Dr
- 4373 Meadow Vista Dr Unit 4373
- 4373 Meadow Vista Dr