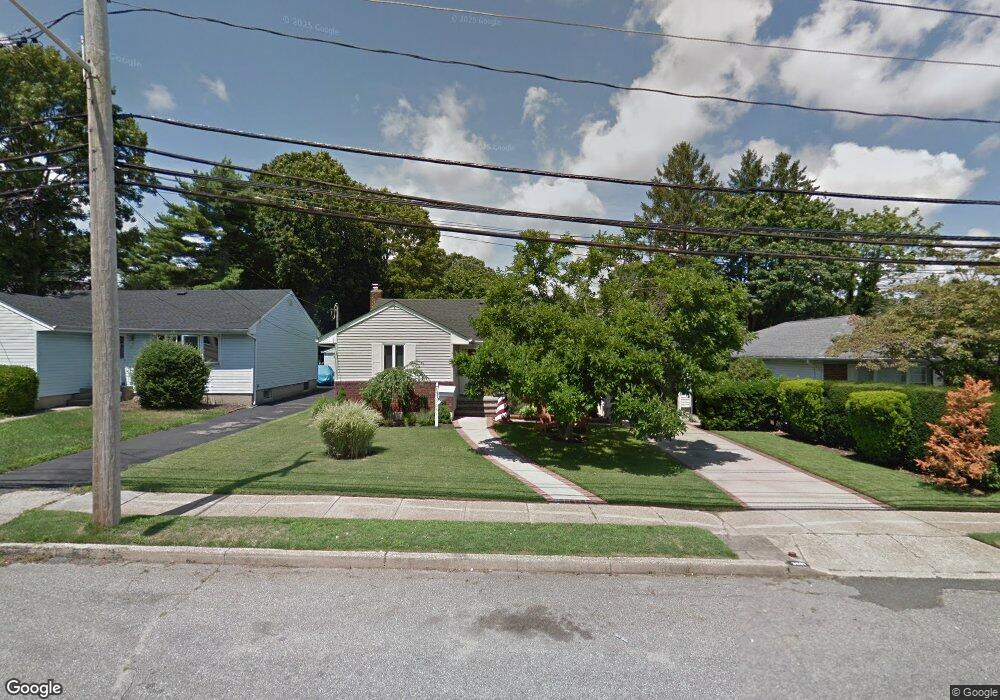
3687 Park Ave Wantagh, NY 11793
Estimated Value: $612,161 - $693,000
--
Bed
1
Bath
1,050
Sq Ft
$622/Sq Ft
Est. Value
About This Home
This home is located at 3687 Park Ave, Wantagh, NY 11793 and is currently estimated at $652,581, approximately $621 per square foot. 3687 Park Ave is a home located in Nassau County with nearby schools including Wantagh Middle School, Wantagh Senior High School, and Maplewood School.
Ownership History
Date
Name
Owned For
Owner Type
Purchase Details
Closed on
Sep 1, 2016
Sold by
Clark Peter P and Caliendo Charles
Bought by
Caliendo Charles
Current Estimated Value
Home Financials for this Owner
Home Financials are based on the most recent Mortgage that was taken out on this home.
Original Mortgage
$155,000
Outstanding Balance
$123,808
Interest Rate
3.43%
Mortgage Type
New Conventional
Estimated Equity
$528,773
Purchase Details
Closed on
Apr 29, 2011
Sold by
Clark Peter P
Bought by
Clark Peter P and Caliendo Charles
Purchase Details
Closed on
Jun 15, 2010
Sold by
Clark Peter and Brennan Victoria
Bought by
Brennan Victoria
Purchase Details
Closed on
Dec 28, 1999
Sold by
Gustavson Roy E
Bought by
Clark Peter
Home Financials for this Owner
Home Financials are based on the most recent Mortgage that was taken out on this home.
Original Mortgage
$160,000
Interest Rate
7.73%
Mortgage Type
Purchase Money Mortgage
Purchase Details
Closed on
Oct 26, 1998
Create a Home Valuation Report for This Property
The Home Valuation Report is an in-depth analysis detailing your home's value as well as a comparison with similar homes in the area
Home Values in the Area
Average Home Value in this Area
Purchase History
| Date | Buyer | Sale Price | Title Company |
|---|---|---|---|
| Caliendo Charles | -- | Chicago Title Insurance Comp | |
| Clark Peter P | $140,000 | -- | |
| Brennan Victoria | -- | -- | |
| Clark Peter | $200,000 | Fidelity National Title Ins | |
| -- | $120,000 | -- |
Source: Public Records
Mortgage History
| Date | Status | Borrower | Loan Amount |
|---|---|---|---|
| Open | Caliendo Charles | $155,000 | |
| Previous Owner | Clark Peter | $160,000 |
Source: Public Records
Tax History Compared to Growth
Tax History
| Year | Tax Paid | Tax Assessment Tax Assessment Total Assessment is a certain percentage of the fair market value that is determined by local assessors to be the total taxable value of land and additions on the property. | Land | Improvement |
|---|---|---|---|---|
| 2025 | $11,629 | $440 | $185 | $255 |
| 2024 | $3,156 | $450 | $189 | $261 |
| 2023 | $9,642 | $442 | $186 | $256 |
| 2022 | $9,642 | $476 | $200 | $276 |
| 2021 | $13,994 | $460 | $193 | $267 |
| 2020 | $9,546 | $545 | $522 | $23 |
| 2019 | $8,416 | $606 | $580 | $26 |
| 2018 | $8,839 | $606 | $0 | $0 |
| 2017 | $5,216 | $606 | $580 | $26 |
| 2016 | $7,862 | $606 | $580 | $26 |
| 2015 | $2,469 | $606 | $421 | $185 |
| 2014 | $2,469 | $606 | $421 | $185 |
| 2013 | $2,316 | $606 | $421 | $185 |
Source: Public Records
Map
Nearby Homes
- 3731 Park Ave
- 3674 Park Ave Unit 1D
- 3799 Mansfield Dr
- 1823 Lincoln Ave
- 3615 Franklin St
- 3637 John St
- 3809 Lincoln St
- 1630 Temple Dr
- 3862 Clark St
- 1605 Henry Rd
- 1808 Oakland Ave
- 3860 Maplewood Dr
- 1555 Henry Rd
- 3861 Hickory St
- 3832 Hickory St
- 2067 Jackson Ave
- 3902 Beechwood Place
- 3462 Ella Rd
- 3728 E End
- 3969 Marlow Ct
- 3683 Park Ave
- 3693 Park Ave
- 1880 Jeffrey Ct
- 3681 Park Ave
- 1891 Jeffrey Ct
- 1870 Jeffrey Ct
- 3675 Park Ave
- 1879 Jeffrey Ct
- 3674 Park Ave Unit 2 D
- 3674 Park Ave Unit 1-C
- 3672 Park Ave Unit 1E
- 3672 Park Ave Unit F
- 3672 Park Ave Unit 3672
- 3676 Park Ave Unit 1B
- 3669 Park Ave
- 1871 Jeffrey Ct
- 3715 Park Ave
- 1866 Jeffrey Ct
- 1864 Jeffrey Ct
- 3673 Park Ave