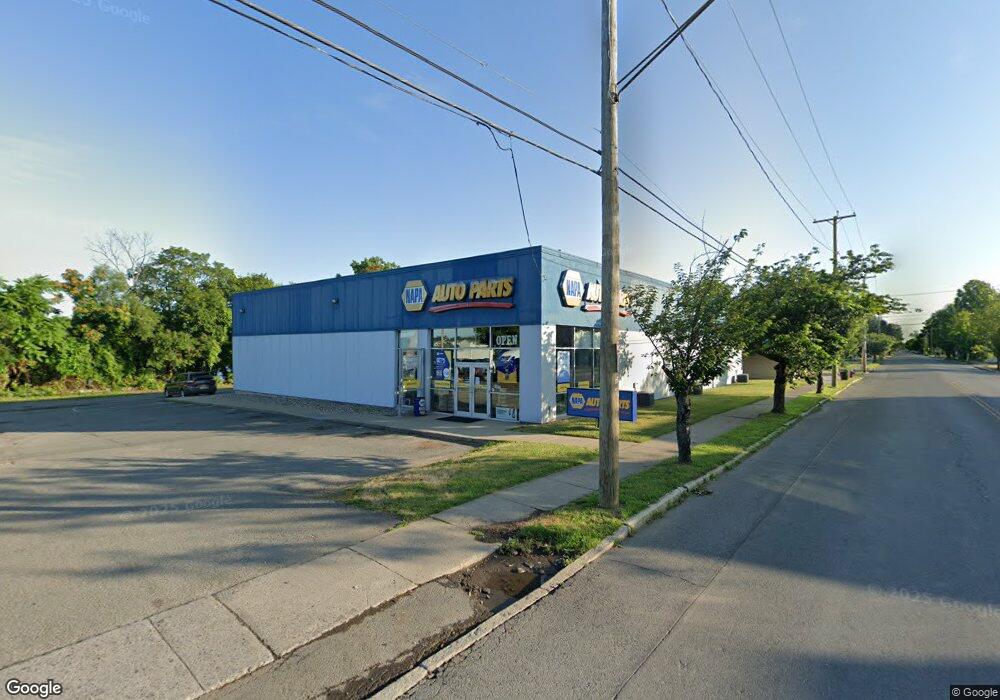
369 2nd Ave Troy, NY 12182
Lansingburgh NeighborhoodEstimated Value: $1,201,552
Studio
--
Bath
10,455
Sq Ft
$115/Sq Ft
Est. Value
About This Home
This home is located at 369 2nd Ave, Troy, NY 12182 and is currently estimated at $1,201,552, approximately $114 per square foot. 369 2nd Ave is a home located in Rensselaer County with nearby schools including Turnpike Elementary School, Rensselaer Park Elementary School, and Knickerbacker Middle School.
Ownership History
Date
Name
Owned For
Owner Type
Purchase Details
Closed on
Sep 27, 2024
Sold by
Fsc Gpc Troy Ny Llc
Bought by
North Street Holdings Llc
Current Estimated Value
Purchase Details
Closed on
Dec 18, 2018
Sold by
369 2Nd Avenue Llc
Bought by
Fsc Gpc Troy Ny Llc
Purchase Details
Closed on
Nov 4, 1996
Sold by
Nugent Timothy Esq -Referee
Bought by
Lansing Plaza Inc
Purchase Details
Closed on
Jun 21, 1996
Sold by
Larco Properties Inc
Bought by
Lansing Plaza Inc
Purchase Details
Closed on
Nov 17, 1994
Sold by
Darling John E Referee
Bought by
Larco Properties Inc
Create a Home Valuation Report for This Property
The Home Valuation Report is an in-depth analysis detailing your home's value as well as a comparison with similar homes in the area
Home Values in the Area
Average Home Value in this Area
Purchase History
| Date | Buyer | Sale Price | Title Company |
|---|---|---|---|
| North Street Holdings Llc | $1,100,000 | None Available | |
| North Street Holdings Llc | $1,100,000 | None Available | |
| North Street Holdings Llc | $1,100,000 | None Available | |
| Fsc Gpc Troy Ny Llc | $1,088,400 | -- | |
| Fsc Gpc Troy Ny Llc | $1,088,400 | -- | |
| Fsc Gpc Troy Ny Llc | $1,088,400 | -- | |
| Fsc Gpc Troy Ny Llc | $1,088,400 | -- | |
| Lansing Plaza Inc | $118,000 | -- | |
| Lansing Plaza Inc | $118,000 | -- | |
| Lansing Plaza Inc | $143,000 | -- | |
| Lansing Plaza Inc | $143,000 | -- | |
| Larco Properties Inc | $105,000 | -- | |
| Larco Properties Inc | $105,000 | -- |
Source: Public Records
Tax History
| Year | Tax Paid | Tax Assessment Tax Assessment Total Assessment is a certain percentage of the fair market value that is determined by local assessors to be the total taxable value of land and additions on the property. | Land | Improvement |
|---|---|---|---|---|
| 2024 | $26,048 | $570,000 | $280,000 | $290,000 |
| 2023 | $25,538 | $570,000 | $280,000 | $290,000 |
| 2022 | $24,856 | $570,000 | $280,000 | $290,000 |
| 2021 | $6,491 | $570,000 | $280,000 | $290,000 |
| 2020 | $11,748 | $570,000 | $280,000 | $290,000 |
| 2019 | $17,683 | $570,000 | $280,000 | $290,000 |
| 2018 | $17,683 | $570,000 | $280,000 | $290,000 |
| 2017 | $17,455 | $570,000 | $280,000 | $290,000 |
| 2016 | $23,590 | $570,000 | $280,000 | $290,000 |
| 2015 | -- | $570,000 | $280,000 | $290,000 |
| 2014 | -- | $570,000 | $280,000 | $290,000 |
Source: Public Records
Map
Nearby Homes
Your Personal Tour Guide
Ask me questions while you tour the home.