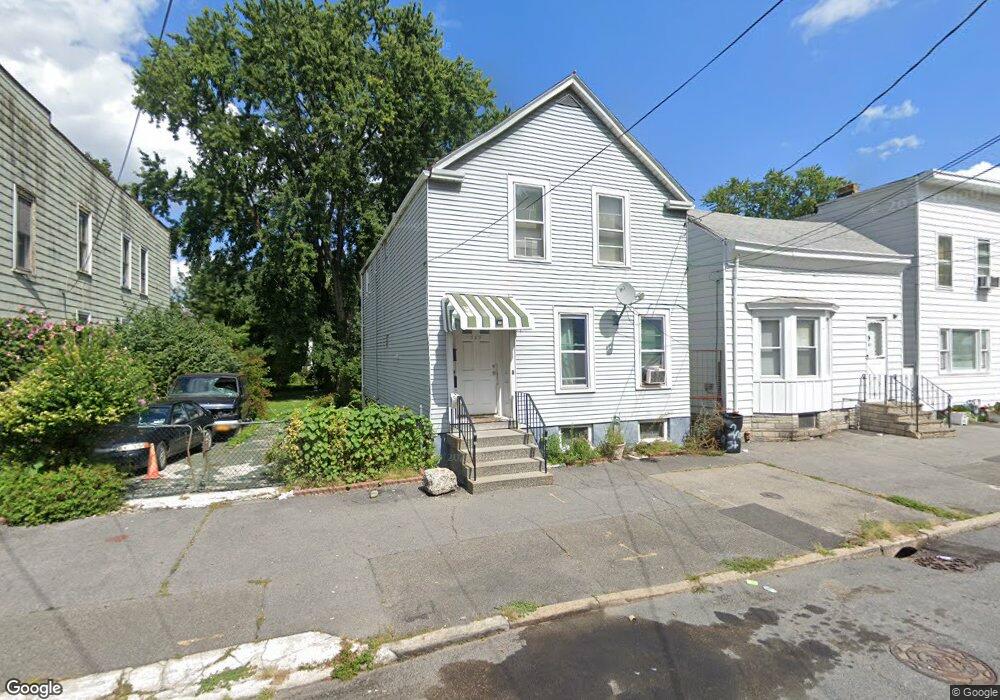
369 2nd St Unit 2 Albany, NY 12206
West Hill NeighborhoodEstimated Value: $111,000 - $137,000
2
Beds
1
Bath
500
Sq Ft
$245/Sq Ft
Est. Value
About This Home
This home is located at 369 2nd St Unit 2, Albany, NY 12206 and is currently estimated at $122,558, approximately $245 per square foot. 369 2nd St Unit 2 is a home located in Albany County with nearby schools including Sheridan Preparatory Academy, Stephen And Harriet Myers Middle School, and Albany High School.
Ownership History
Date
Name
Owned For
Owner Type
Purchase Details
Closed on
Dec 8, 2025
Sold by
Henry Johnson Llc
Bought by
Aurum Edge Property Group Llc
Current Estimated Value
Home Financials for this Owner
Home Financials are based on the most recent Mortgage that was taken out on this home.
Original Mortgage
$152,800
Outstanding Balance
$152,653
Interest Rate
6.17%
Mortgage Type
Credit Line Revolving
Estimated Equity
-$30,095
Purchase Details
Closed on
May 9, 2023
Sold by
Sim Theresa G
Bought by
Sim Alowyn
Purchase Details
Closed on
Jul 20, 2022
Sold by
Hernandez Roberto
Bought by
Henry Johnson Llc
Home Financials for this Owner
Home Financials are based on the most recent Mortgage that was taken out on this home.
Original Mortgage
$86,000
Interest Rate
5.81%
Mortgage Type
New Conventional
Purchase Details
Closed on
Jul 11, 2018
Sold by
U S Bank National Association
Bought by
Hernandez Roberto
Create a Home Valuation Report for This Property
The Home Valuation Report is an in-depth analysis detailing your home's value as well as a comparison with similar homes in the area
Home Values in the Area
Average Home Value in this Area
Purchase History
| Date | Buyer | Sale Price | Title Company |
|---|---|---|---|
| Aurum Edge Property Group Llc | $191,000 | Vertex Title | |
| Sim Alowyn | $70,000 | None Listed On Document | |
| Henry Johnson Llc | $100,000 | Amtrust Title Insurance Co | |
| Hernandez Roberto | $32,500 | None Available |
Source: Public Records
Mortgage History
| Date | Status | Borrower | Loan Amount |
|---|---|---|---|
| Open | Aurum Edge Property Group Llc | $152,800 | |
| Previous Owner | Henry Johnson Llc | $86,000 |
Source: Public Records
Tax History
| Year | Tax Paid | Tax Assessment Tax Assessment Total Assessment is a certain percentage of the fair market value that is determined by local assessors to be the total taxable value of land and additions on the property. | Land | Improvement |
|---|---|---|---|---|
| 2024 | $4,358 | $84,000 | $16,800 | $67,200 |
| 2023 | $2,553 | $55,000 | $11,600 | $43,400 |
| 2022 | $2,300 | $55,000 | $11,600 | $43,400 |
| 2021 | $2,295 | $55,000 | $11,600 | $43,400 |
| 2020 | $2,263 | $55,000 | $11,600 | $43,400 |
| 2019 | $2,165 | $55,000 | $11,600 | $43,400 |
| 2018 | $2,570 | $55,000 | $11,600 | $43,400 |
| 2017 | $3,386 | $55,000 | $11,600 | $43,400 |
| 2016 | $3,177 | $55,000 | $11,600 | $43,400 |
| 2015 | $3,433 | $56,600 | $11,300 | $45,300 |
| 2014 | -- | $56,600 | $11,300 | $45,300 |
Source: Public Records
Map
Nearby Homes
Your Personal Tour Guide
Ask me questions while you tour the home.