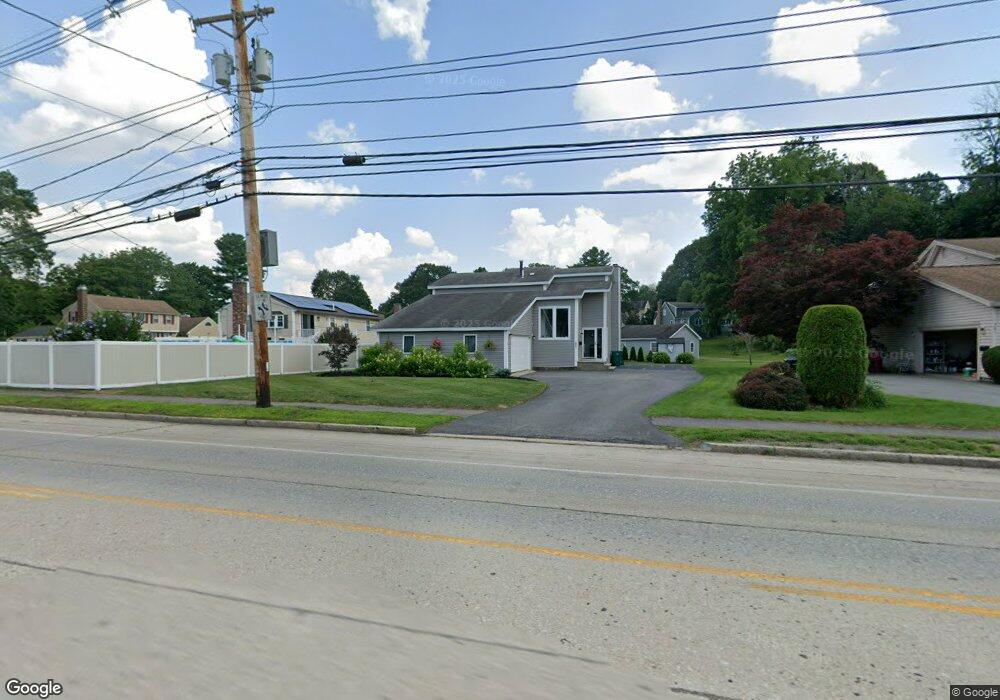
369 Andover St Lowell, MA 01852
Belvidere NeighborhoodEstimated Value: $682,000 - $835,000
3
Beds
3
Baths
2,372
Sq Ft
$314/Sq Ft
Est. Value
About This Home
This home is located at 369 Andover St, Lowell, MA 01852 and is currently estimated at $745,775, approximately $314 per square foot. 369 Andover St is a home located in Middlesex County with nearby schools including Moody Elementary School, Abraham Lincoln Elementary School, and Greenhalge Elementary School.
Ownership History
Date
Name
Owned For
Owner Type
Purchase Details
Closed on
Jun 25, 2015
Sold by
Elias David L
Bought by
Finnegan Martin D and Mcmhaon Donna G
Current Estimated Value
Home Financials for this Owner
Home Financials are based on the most recent Mortgage that was taken out on this home.
Original Mortgage
$330,891
Interest Rate
3.5%
Mortgage Type
FHA
Purchase Details
Closed on
Oct 18, 2010
Sold by
Elias Ellanjean and Elias David L
Bought by
Elias David L
Home Financials for this Owner
Home Financials are based on the most recent Mortgage that was taken out on this home.
Original Mortgage
$185,000
Interest Rate
4.22%
Purchase Details
Closed on
Jul 2, 1987
Sold by
Crenz Hernando
Bought by
Elias David L
Create a Home Valuation Report for This Property
The Home Valuation Report is an in-depth analysis detailing your home's value as well as a comparison with similar homes in the area
Home Values in the Area
Average Home Value in this Area
Purchase History
| Date | Buyer | Sale Price | Title Company |
|---|---|---|---|
| Finnegan Martin D | $337,000 | -- | |
| Elias David L | -- | -- | |
| Elias David L | -- | -- | |
| Elias David L | $228,000 | -- |
Source: Public Records
Mortgage History
| Date | Status | Borrower | Loan Amount |
|---|---|---|---|
| Closed | Finnegan Martin D | $330,891 | |
| Previous Owner | Elias David L | $185,000 |
Source: Public Records
Tax History
| Year | Tax Paid | Tax Assessment Tax Assessment Total Assessment is a certain percentage of the fair market value that is determined by local assessors to be the total taxable value of land and additions on the property. | Land | Improvement |
|---|---|---|---|---|
| 2025 | $7,759 | $675,900 | $241,400 | $434,500 |
| 2024 | $7,515 | $631,000 | $225,600 | $405,400 |
| 2023 | $7,315 | $589,000 | $196,200 | $392,800 |
| 2022 | $6,952 | $547,800 | $178,300 | $369,500 |
| 2021 | $6,367 | $473,000 | $155,100 | $317,900 |
| 2020 | $6,168 | $461,700 | $155,100 | $306,600 |
| 2019 | $6,380 | $454,400 | $154,300 | $300,100 |
| 2018 | $6,363 | $442,200 | $146,900 | $295,300 |
| 2017 | $6,083 | $407,700 | $136,300 | $271,400 |
| 2016 | $5,943 | $392,000 | $125,400 | $266,600 |
| 2015 | $5,498 | $355,200 | $125,400 | $229,800 |
| 2013 | $4,877 | $324,900 | $138,400 | $186,500 |
Source: Public Records
Map
Nearby Homes
- 42 Pentucket Ave
- 325 1st St Unit 209
- 234 Nesmith St Unit 8
- 44 Hanks St
- 313 Nesmith St
- 317 Nesmith St
- 200 Rogers St Unit 6
- 42 Christian St
- 52 Christian St
- 158 Concord St
- 3 Vernon St
- 82 Christian St
- 192 1st St
- 88 Perry St
- 164 Bradley St
- Lots 1-12 Christian Hill Dev
- 81 Reservoir St
- 45 Clark Rd
- 105 3rd St
- 94 1st St Unit 10
Your Personal Tour Guide
Ask me questions while you tour the home.