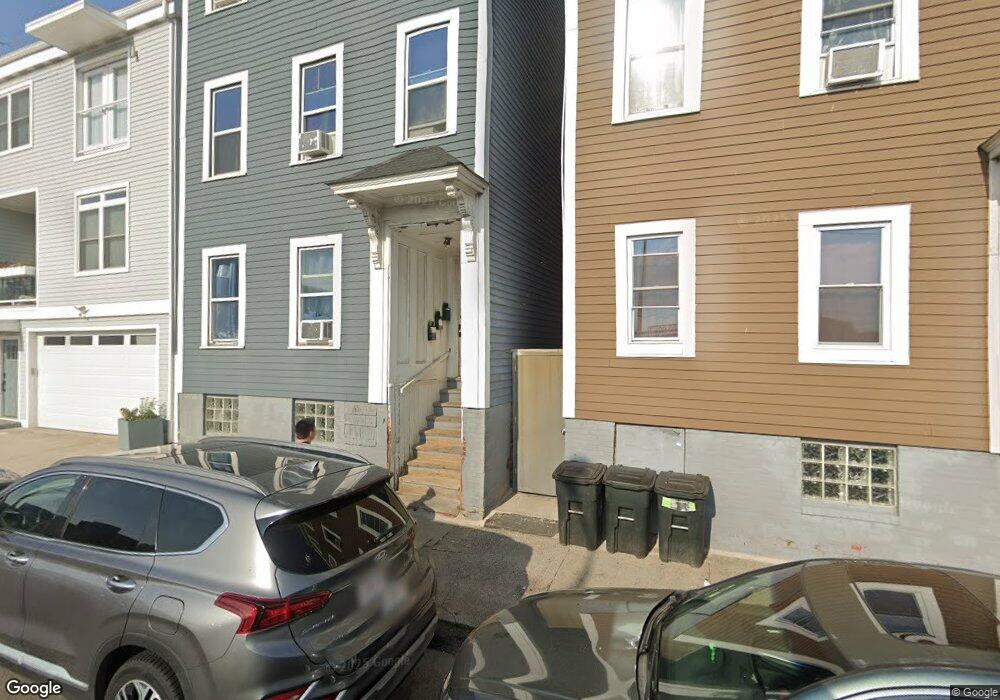
369 Border St Boston, MA 02128
Estimated Value: $784,000 - $1,020,000
3
Beds
3
Baths
2,290
Sq Ft
$393/Sq Ft
Est. Value
About This Home
This home is located at 369 Border St, Boston, MA 02128 and is currently estimated at $899,000, approximately $392 per square foot. 369 Border St is a home located in Suffolk County with nearby schools including East Boston Central Catholic School.
Ownership History
Date
Name
Owned For
Owner Type
Purchase Details
Closed on
Jun 26, 2014
Sold by
Dead Reckoning Llc
Bought by
Peter Pan Properties L
Current Estimated Value
Home Financials for this Owner
Home Financials are based on the most recent Mortgage that was taken out on this home.
Original Mortgage
$2,900,000
Outstanding Balance
$2,192,019
Interest Rate
4.19%
Mortgage Type
Purchase Money Mortgage
Estimated Equity
-$1,293,019
Create a Home Valuation Report for This Property
The Home Valuation Report is an in-depth analysis detailing your home's value as well as a comparison with similar homes in the area
Purchase History
| Date | Buyer | Sale Price | Title Company |
|---|---|---|---|
| Peter Pan Properties L | -- | -- |
Source: Public Records
Mortgage History
| Date | Status | Borrower | Loan Amount |
|---|---|---|---|
| Open | Peter Pan Properties L | $2,900,000 |
Source: Public Records
Tax History
| Year | Tax Paid | Tax Assessment Tax Assessment Total Assessment is a certain percentage of the fair market value that is determined by local assessors to be the total taxable value of land and additions on the property. | Land | Improvement |
|---|---|---|---|---|
| 2025 | $10,681 | $922,400 | $237,600 | $684,800 |
| 2024 | $9,311 | $854,200 | $248,200 | $606,000 |
| 2023 | $9,082 | $845,600 | $245,700 | $599,900 |
| 2022 | $8,441 | $775,800 | $225,400 | $550,400 |
| 2021 | $8,278 | $775,800 | $225,400 | $550,400 |
| 2020 | $7,528 | $712,900 | $251,000 | $461,900 |
| 2019 | $6,709 | $636,500 | $151,200 | $485,300 |
| 2018 | $5,623 | $536,500 | $151,200 | $385,300 |
| 2017 | $4,843 | $457,300 | $151,200 | $306,100 |
| 2016 | $3,132 | $284,700 | $151,200 | $133,500 |
| 2015 | $1,893 | $156,300 | $111,800 | $44,500 |
| 2014 | $1,710 | $135,900 | $111,800 | $24,100 |
Source: Public Records
Map
Nearby Homes
- 379 Meridian St Unit 101
- 412 Meridian St Unit 3
- 5 Monmouth St
- 25 Monmouth St
- 25 Monmouth St Unit SF
- 301 Border St Unit 511
- 301 Border St Unit 411
- 301 Border St Unit 211
- 301 Border St Unit 601
- 301 Border St Unit 409
- 301 Border St Unit 603
- 42 W Eagle St Unit 2
- 64 Trenton St
- 76 Eutaw St
- 80 Marion St Unit 2
- 277 Border St Unit 204
- 47 Condor St Unit 201
- 47 Condor St Unit 203
- 47 Condor St Unit 302
- 47 Condor St Unit 301
- 373 Border St
- 367 Border St
- 375 Border St
- 402 Meridian St
- 402 Meridian St Unit 4
- 402 Meridian St Unit 1
- 402 Meridian St Unit 2
- 402 Meridian St Unit 3
- 404 Meridian St Unit 7
- 404 Meridian St Unit 6
- 404 Meridian St Unit 5
- 404 Meridian St Unit 4
- 404 Meridian St Unit 3
- 404 Meridian St Unit 2
- 404 Meridian St Unit 1
- 404 Meridian St Unit 2B
- 404 Meridian St Unit 1B
- 404 Meridian St Unit Rear
- 404 Meridian St
- 404 Meridian St Unit 1R
Your Personal Tour Guide
Ask me questions while you tour the home.