W
Seller's Agent in 2019
Willie Mandrell
Thumbprint Realty, LLC
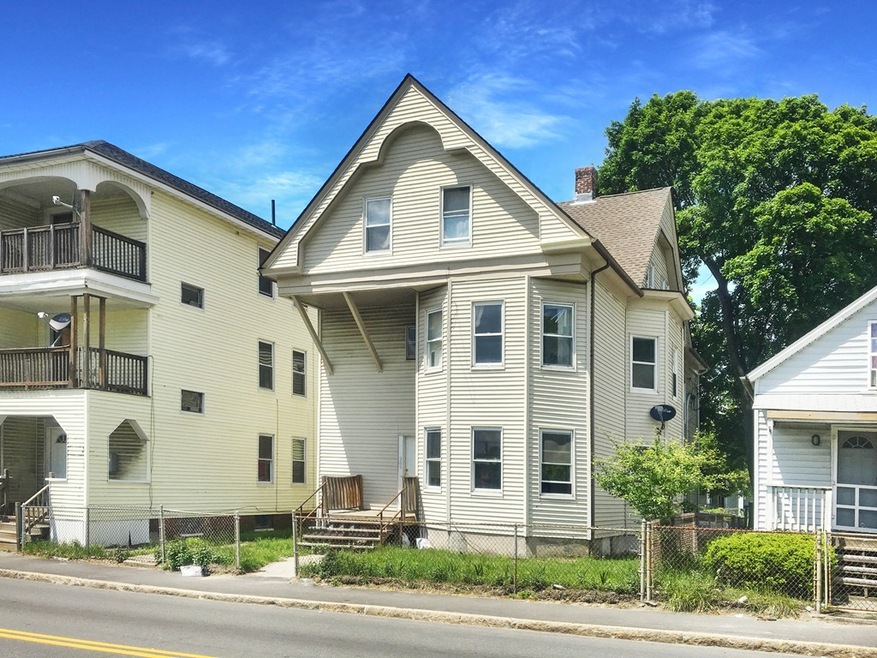

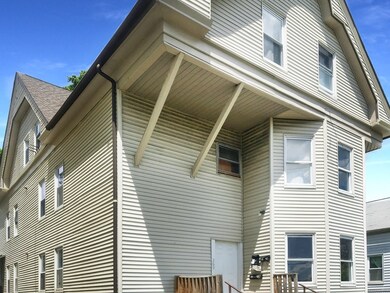


OVER $32,000 IN ANNUAL GROSS RENTS when fully occupied!! Fantastic opportunity to own a great rental property in ideal commuter location minutes to Rt 146, 20, 90, and 9 and across the St from South Worcester Playground! This building has some great updates! Vinyl windows, siding, circuit breakers, interior features, etc...Parking is available in the rear of the building.
Home Type
Multi-Family
Est. Annual Taxes
$8,831
Year Built
1900
Lot Details
0
| Date | Type | Sale Price | Title Company |
|---|---|---|---|
| Condominium Deed | $359,000 | -- | |
| Not Resolvable | $255,000 | -- | |
| Deed | $81,000 | -- | |
| Foreclosure Deed | $105,879 | -- | |
| Deed | -- | -- | |
| Deed | $124,900 | -- | |
| Foreclosure Deed | $282,807 | -- | |
| Deed | $275,000 | -- | |
| Deed | $60,000 | -- | |
| Deed | $64,500 | -- |
| Date | Status | Loan Amount | Loan Type |
|---|---|---|---|
| Open | $352,497 | FHA | |
| Previous Owner | $204,000 | New Conventional | |
| Previous Owner | $725,000 | No Value Available | |
| Previous Owner | $93,675 | Purchase Money Mortgage | |
| Previous Owner | $264,000 | No Value Available | |
| Previous Owner | $66,000 | No Value Available | |
| Previous Owner | $247,500 | Purchase Money Mortgage | |
| Previous Owner | $62,000 | No Value Available | |
| Previous Owner | $59,950 | Purchase Money Mortgage |
| Date | Event | Price | Change | Sq Ft Price |
|---|---|---|---|---|
| 07/12/2019 07/12/19 | Sold | $359,000 | +2.9% | $115 / Sq Ft |
| 06/13/2019 06/13/19 | Pending | -- | -- | -- |
| 05/30/2019 05/30/19 | For Sale | $349,000 | 0.0% | $112 / Sq Ft |
| 04/25/2019 04/25/19 | Pending | -- | -- | -- |
| 04/15/2019 04/15/19 | For Sale | $349,000 | +36.9% | $112 / Sq Ft |
| 07/18/2018 07/18/18 | Sold | $255,000 | -7.2% | $81 / Sq Ft |
| 06/01/2018 06/01/18 | Pending | -- | -- | -- |
| 05/16/2018 05/16/18 | Price Changed | $274,900 | -1.8% | $88 / Sq Ft |
| 05/07/2018 05/07/18 | Price Changed | $279,900 | -1.8% | $89 / Sq Ft |
| 05/01/2018 05/01/18 | Price Changed | $284,900 | -1.7% | $91 / Sq Ft |
| 04/23/2018 04/23/18 | Price Changed | $289,900 | -1.7% | $93 / Sq Ft |
| 04/13/2018 04/13/18 | Price Changed | $294,900 | -1.0% | $94 / Sq Ft |
| 04/05/2018 04/05/18 | Price Changed | $297,900 | -0.3% | $95 / Sq Ft |
| 03/21/2018 03/21/18 | Price Changed | $298,900 | -0.3% | $96 / Sq Ft |
| 01/25/2018 01/25/18 | Price Changed | $299,900 | -3.2% | $96 / Sq Ft |
| 01/08/2018 01/08/18 | Price Changed | $309,900 | -1.6% | $99 / Sq Ft |
| 07/31/2017 07/31/17 | Price Changed | $315,000 | +1.6% | $101 / Sq Ft |
| 06/09/2017 06/09/17 | For Sale | $309,999 | -- | $99 / Sq Ft |
| Year | Tax Paid | Tax Assessment Tax Assessment Total Assessment is a certain percentage of the fair market value that is determined by local assessors to be the total taxable value of land and additions on the property. | Land | Improvement |
|---|---|---|---|---|
| 2025 | $8,831 | $669,500 | $44,500 | $625,000 |
| 2024 | $8,533 | $620,600 | $44,500 | $576,100 |
| 2023 | $7,864 | $548,400 | $35,200 | $513,200 |
| 2022 | $7,118 | $468,000 | $28,200 | $439,800 |
| 2021 | $6,063 | $372,400 | $22,500 | $349,900 |
| 2020 | $5,600 | $329,400 | $22,500 | $306,900 |
| 2019 | $3,586 | $199,200 | $21,500 | $177,700 |
| 2018 | $3,627 | $191,800 | $21,500 | $170,300 |
| 2017 | $3,410 | $177,400 | $21,500 | $155,900 |
| 2016 | $3,380 | $164,000 | $15,500 | $148,500 |
| 2015 | $3,291 | $164,000 | $15,500 | $148,500 |
| 2014 | $3,205 | $164,000 | $15,500 | $148,500 |
W
Seller's Agent in 2019
Willie Mandrell
Thumbprint Realty, LLC

Buyer's Agent in 2019
Charles Parrilla
Property Investors & Advisors, LLC
(508) 714-9112
53 Total Sales
Seller's Agent in 2018
Phillip Olivo
P & H Property Consulting, Inc.
(508) 735-4956
41 Total Sales
Buyer's Agent in 2018
Tayana Antin
YPC Real Estate
(617) 905-2455
4 Total Sales
Source: MLS Property Information Network (MLS PIN)
MLS Number: 72179456
APN: WORC-000007-000022-000022
Disclaimer: Certain information contained herein is derived from information provided by parties other than Homes.com. All information provided is deemed reliable, but is not guaranteed to be accurate and should be independently verified.
![]() The property listing data and information, or the Images, set forth herein were provided to MLS Property Information Network, Inc. from third party sources, including sellers, lessors and public records, and were compiled by MLS Property Information Network, Inc. The property listing data and information, and the Images, are for the personal, non-commercial use of consumers having a good faith interest in purchasing or leasing listed properties of the type displayed to them and may not be used for any purpose other than to identify prospective properties which such consumers may have a good faith interest in purchasing or leasing. MLS Property Information Network, Inc. and its subscribers disclaim any and all representations and warranties as to the accuracy of the property listing data and information, or as to the accuracy of any of the Images, set forth herein.
The property listing data and information, or the Images, set forth herein were provided to MLS Property Information Network, Inc. from third party sources, including sellers, lessors and public records, and were compiled by MLS Property Information Network, Inc. The property listing data and information, and the Images, are for the personal, non-commercial use of consumers having a good faith interest in purchasing or leasing listed properties of the type displayed to them and may not be used for any purpose other than to identify prospective properties which such consumers may have a good faith interest in purchasing or leasing. MLS Property Information Network, Inc. and its subscribers disclaim any and all representations and warranties as to the accuracy of the property listing data and information, or as to the accuracy of any of the Images, set forth herein.