
Seller's Agent in 2024
Tiffany Glasco
Keller Williams River Cities
(706) 325-2839
9 in this area
50 Total Sales
Estimated Value: $37,000 - $47,210
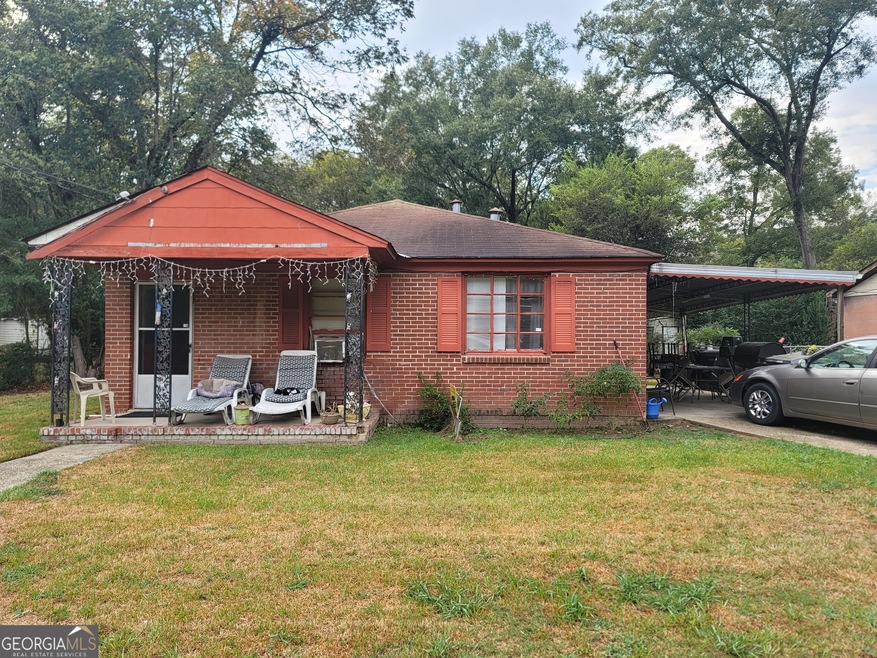
Enjoy this cozy 2bd 1ba all brick well-maintained house. Roof is under 10 years old. Nice size fenced in back yard.
Last Agent to Sell the Property
Keller Williams River Cities License #403651 Listed on: 10/09/2023
Last Buyer's Agent
Keller Williams River Cities License #403651 Listed on: 10/09/2023
| Date | Buyer | Sale Price | Title Company |
|---|---|---|---|
| Hawkins Lavina | $37,000 | None Listed On Document | |
| R & G Real Estate Investors Llc | -- | None Available | |
| R & G Real Estate Investors Llc | -- | -- |
| Date | Event | Price | List to Sale | Price per Sq Ft |
|---|---|---|---|---|
| 01/29/2024 01/29/24 | Sold | $37,000 | -11.9% | $47 / Sq Ft |
| 01/02/2024 01/02/24 | Pending | -- | -- | -- |
| 12/29/2023 12/29/23 | Price Changed | $42,000 | -10.6% | $54 / Sq Ft |
| 12/29/2023 12/29/23 | For Sale | $47,000 | 0.0% | $60 / Sq Ft |
| 12/21/2023 12/21/23 | Pending | -- | -- | -- |
| 12/14/2023 12/14/23 | Price Changed | $47,000 | -6.0% | $60 / Sq Ft |
| 10/09/2023 10/09/23 | For Sale | $50,000 | -- | $64 / Sq Ft |
| Year | Tax Paid | Tax Assessment Tax Assessment Total Assessment is a certain percentage of the fair market value that is determined by local assessors to be the total taxable value of land and additions on the property. | Land | Improvement |
|---|---|---|---|---|
| 2025 | $623 | $15,924 | $2,944 | $12,980 |
| 2024 | $620 | $15,836 | $3,144 | $12,692 |
| 2023 | $624 | $15,836 | $3,144 | $12,692 |
| 2022 | $572 | $14,000 | $3,144 | $10,856 |
| 2021 | $578 | $13,288 | $3,144 | $10,144 |
| 2020 | $543 | $13,288 | $3,144 | $10,144 |
| 2019 | $544 | $13,288 | $3,144 | $10,144 |
| 2018 | $544 | $13,288 | $3,144 | $10,144 |
| 2017 | $546 | $13,288 | $3,144 | $10,144 |
| 2016 | $422 | $10,239 | $2,137 | $8,102 |
| 2015 | $169 | $10,239 | $2,137 | $8,102 |
| 2014 | $423 | $10,239 | $2,137 | $8,102 |
| 2013 | -- | $10,239 | $2,137 | $8,102 |
Seller's Agent in 2024
Tiffany Glasco
Keller Williams River Cities
(706) 325-2839
9 in this area
50 Total Sales
Source: Georgia MLS
MLS Number: 10212006
APN: 047-005-032
Disclaimer: Certain information contained herein is derived from information provided by parties other than Homes.com. All information provided is deemed reliable, but is not guaranteed to be accurate and should be independently verified.
![]() The data relating to real estate for sale on this web site comes in part from the Broker Reciprocity Program of Georgia MLS. Real estate listings held by brokerage firms other than Redfin are marked with the Broker Reciprocity logo and detailed information about them includes the name of the listing brokers. Information deemed reliable but not guaranteed. Copyright 2026 Georgia MLS. All rights reserved.
The data relating to real estate for sale on this web site comes in part from the Broker Reciprocity Program of Georgia MLS. Real estate listings held by brokerage firms other than Redfin are marked with the Broker Reciprocity logo and detailed information about them includes the name of the listing brokers. Information deemed reliable but not guaranteed. Copyright 2026 Georgia MLS. All rights reserved.
Ask me questions while you tour the home.