369 Cypress St Fort Bragg, CA 95437
Fort Bragg AreaEstimated Value: $279,798
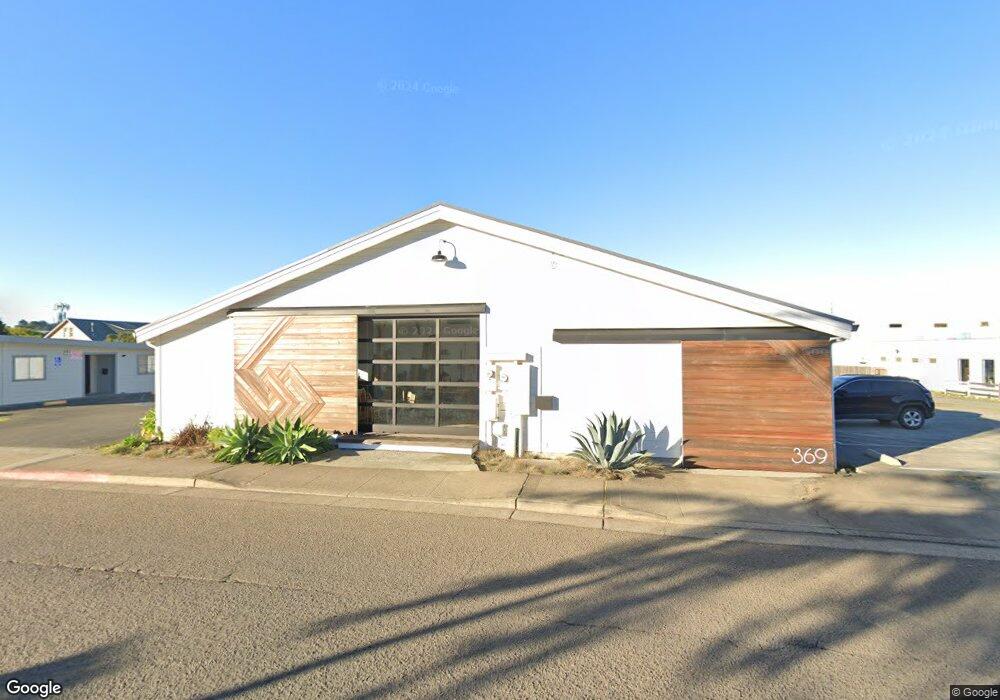
About This Home
This home is located at 369 Cypress St, Fort Bragg, CA 95437 and is currently estimated at $279,798. 369 Cypress St is a home located in Mendocino County with nearby schools including Fort Bragg High School.
Ownership History
We collect this data history from publicly available records. To have your information removed, we recommend requesting removal directly through your county’s website.
Purchase Details
Home Financials for this Owner
Home Financials are based on the most recent Mortgage that was taken out on this home.Purchase Details
Home Financials for this Owner
Home Financials are based on the most recent Mortgage that was taken out on this home.Home Values in the Area
Average Home Value in this Area
Purchase History
We collect this data history from publicly available records. To have your information removed, we recommend requesting removal directly through your county’s website.
| Date | Buyer | Sale Price | Title Company |
|---|---|---|---|
| -- | Redwood Empire Title | ||
| $220,000 | Redwood Empire Title Co Of M |
Mortgage History
We collect this data history from publicly available records. To have your information removed, we recommend requesting removal directly through your county’s website.
| Date | Status | Borrower | Loan Amount |
|---|---|---|---|
| Open | $65,000 | ||
| Open | $190,000 |
Tax History
We collect this data history from publicly available records. To have your information removed, we recommend requesting removal directly through your county’s website.
| Year | Tax Paid | Tax Assessment Tax Assessment Total Assessment is a certain percentage of the fair market value that is determined by local assessors to be the total taxable value of land and additions on the property. | Land | Improvement |
|---|---|---|---|---|
| 2025 | $3,634 | $306,726 | $179,889 | $126,837 |
| 2023 | $3,529 | $294,816 | $172,904 | $121,912 |
| 2022 | $2,934 | $240,599 | $169,514 | $71,085 |
| 2021 | $2,768 | $235,883 | $166,191 | $69,692 |
| 2020 | $2,567 | $233,464 | $164,486 | $68,978 |
| 2019 | $2,676 | $228,888 | $161,262 | $67,626 |
| 2018 | $2,640 | $224,400 | $158,100 | $66,300 |
| 2017 | $2,413 | $220,000 | $155,000 | $65,000 |
| 2016 | $2,174 | $191,846 | $150,466 | $41,380 |
| 2015 | $2,139 | $188,966 | $148,207 | $40,759 |
| 2014 | $2,088 | $185,265 | $145,304 | $39,961 |
Map
- 658 S Franklin St
- 494 S Whipple St
- 480 S Whipple St
- 116 Spring St
- 464 S Whipple St
- 860 Myrtle St
- 459 S Mcpherson St
- 730 E Chestnut St
- 300 N Harbor Dr
- 331 S Franklin St
- 327 S Franklin St
- 260 S Franklin St
- 270 S Whipple St
- 970 E Chestnut St
- 251 S Franklin St
- 150 S Franklin St
- 1021 S Main St Unit 2
- 121 S Mcpherson St
- 165 Livingston St
- 112 Morrow St
Ask me questions while you tour the home.