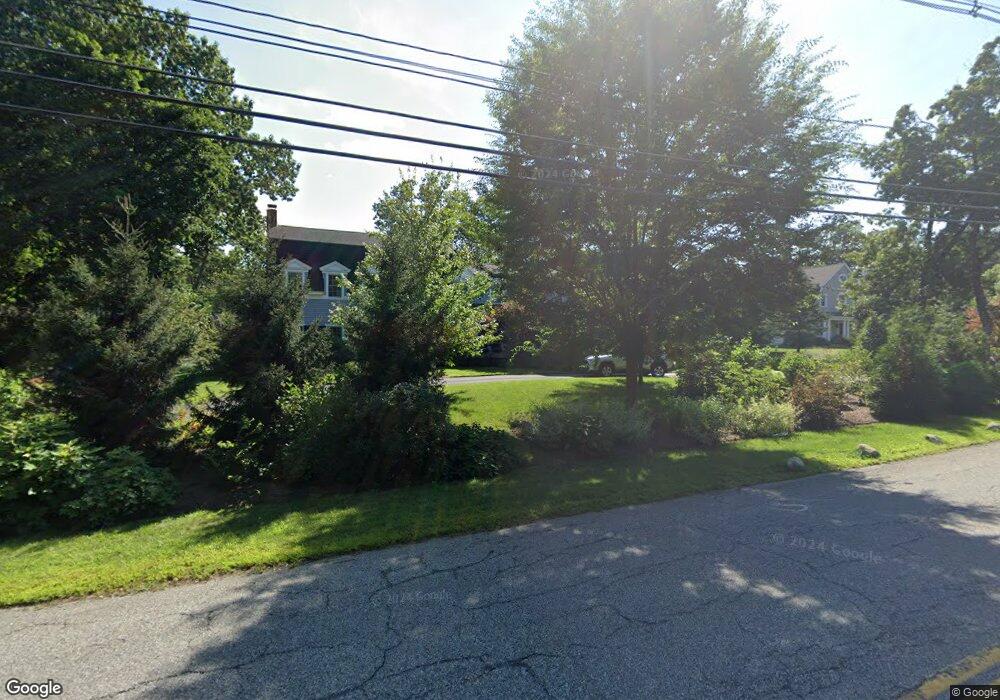
369 Elm St Concord, MA 01742
Estimated Value: $3,032,858 - $3,337,000
6
Beds
7
Baths
5,000
Sq Ft
$622/Sq Ft
Est. Value
About This Home
This home is located at 369 Elm St, Concord, MA 01742 and is currently estimated at $3,112,465, approximately $622 per square foot. 369 Elm St is a home located in Middlesex County with nearby schools including Willard School, Concord Middle School, and Concord Carlisle High School.
Ownership History
Date
Name
Owned For
Owner Type
Purchase Details
Closed on
Dec 10, 2010
Sold by
Ridick Christopher J
Bought by
Thut Andrew F and Thut Elizabeth W
Current Estimated Value
Home Financials for this Owner
Home Financials are based on the most recent Mortgage that was taken out on this home.
Original Mortgage
$1,433,250
Outstanding Balance
$947,884
Interest Rate
4.24%
Mortgage Type
Purchase Money Mortgage
Estimated Equity
$2,164,581
Purchase Details
Closed on
Dec 29, 2009
Sold by
Gustavson Robert J and Gustavson Wilhelmina R
Bought by
Ridick Christopher J
Home Financials for this Owner
Home Financials are based on the most recent Mortgage that was taken out on this home.
Original Mortgage
$1,150,000
Interest Rate
4.92%
Mortgage Type
Purchase Money Mortgage
Purchase Details
Closed on
Jun 28, 1996
Sold by
Garwood Judith
Bought by
Gustavson Robert J and Gustavson Wilhelmina
Purchase Details
Closed on
Jun 30, 1989
Sold by
Finson Michael L
Bought by
Garwood Judy
Create a Home Valuation Report for This Property
The Home Valuation Report is an in-depth analysis detailing your home's value as well as a comparison with similar homes in the area
Home Values in the Area
Average Home Value in this Area
Purchase History
| Date | Buyer | Sale Price | Title Company |
|---|---|---|---|
| Thut Andrew F | $2,047,500 | -- | |
| Ridick Christopher J | $1,025,000 | -- | |
| Gustavson Robert J | $560,000 | -- | |
| Garwood Judy | $615,000 | -- |
Source: Public Records
Mortgage History
| Date | Status | Borrower | Loan Amount |
|---|---|---|---|
| Open | Thut Andrew F | $1,433,250 | |
| Previous Owner | Ridick Christopher J | $1,150,000 | |
| Previous Owner | Garwood Judy | $200,000 | |
| Previous Owner | Garwood Judy | $400,000 | |
| Previous Owner | Garwood Judy | $300,000 |
Source: Public Records
Tax History
| Year | Tax Paid | Tax Assessment Tax Assessment Total Assessment is a certain percentage of the fair market value that is determined by local assessors to be the total taxable value of land and additions on the property. | Land | Improvement |
|---|---|---|---|---|
| 2025 | $411 | $3,102,700 | $1,062,800 | $2,039,900 |
| 2024 | $40,738 | $3,102,700 | $1,062,800 | $2,039,900 |
| 2023 | $32,429 | $2,502,200 | $869,500 | $1,632,700 |
| 2022 | $28,853 | $1,954,800 | $695,400 | $1,259,400 |
| 2021 | $30,257 | $2,055,500 | $695,400 | $1,360,100 |
| 2020 | $30,229 | $2,124,300 | $695,400 | $1,428,900 |
| 2019 | $31,095 | $2,191,300 | $725,100 | $1,466,200 |
| 2018 | $28,324 | $1,982,100 | $642,900 | $1,339,200 |
| 2017 | $26,574 | $1,888,700 | $589,600 | $1,299,100 |
| 2016 | $26,991 | $1,939,000 | $589,600 | $1,349,400 |
| 2015 | $26,539 | $1,857,200 | $545,900 | $1,311,300 |
Source: Public Records
Map
Nearby Homes
- 315 Musketaquid Rd
- 1 Baker Ave
- 101 Adams Rd
- 244 Musterfield Rd
- 106 Elm St
- 2 Willard Common
- 265 Elsinore St
- 55 Staffordshire Ln Unit B
- 16 Concord Greene Unit 5
- 22 Belknap Ct
- 3 Nashawtuc Rd
- 47 Bridgecourt Ln
- 32 Thoreau St Unit 32
- 34 Thoreau St Unit 34
- 79-81 Assabet Ave
- 90 Barretts Mill Rd
- 46 Sudbury Rd
- 28 Devens St
- 150 Hubbard St Unit B
- 111 Central St
Your Personal Tour Guide
Ask me questions while you tour the home.