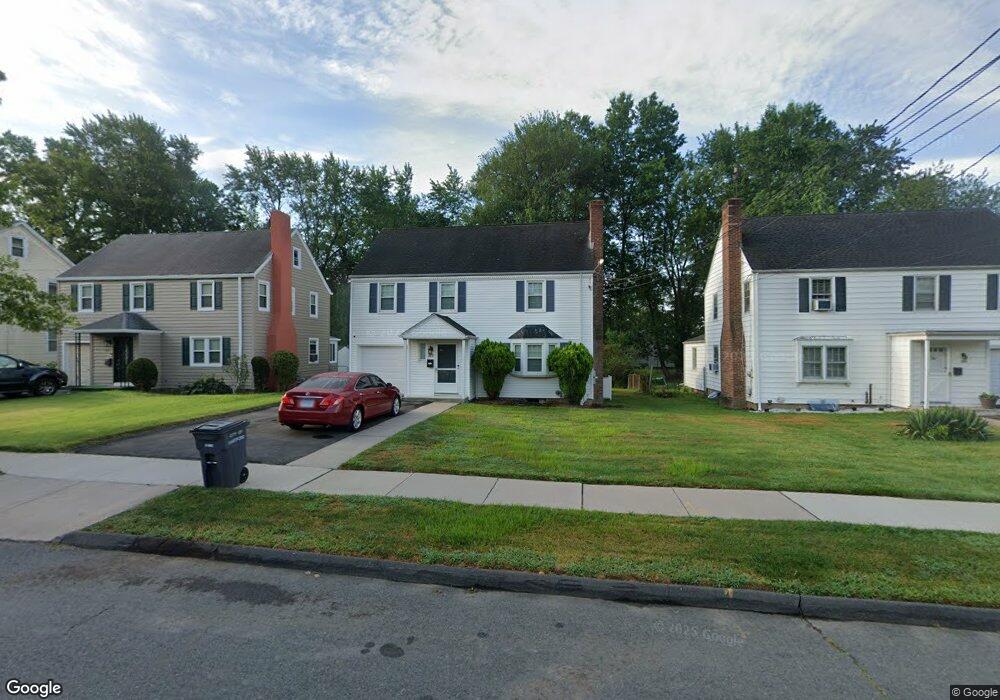
369 Holcomb St Hartford, CT 06112
Blue Hills NeighborhoodEstimated Value: $285,000 - $312,000
3
Beds
2
Baths
1,482
Sq Ft
$200/Sq Ft
Est. Value
About This Home
This home is located at 369 Holcomb St, Hartford, CT 06112 and is currently estimated at $296,626, approximately $200 per square foot. 369 Holcomb St is a home located in Hartford County with nearby schools including Rawson School, Breakthrough Magnet School - North Campus, and West Middle School.
Ownership History
Date
Name
Owned For
Owner Type
Purchase Details
Closed on
Mar 2, 2022
Sold by
Simmons Shalanda B
Bought by
Shirley Shalanda R
Current Estimated Value
Purchase Details
Closed on
Nov 14, 2001
Sold by
Ford Alfred
Bought by
Shirley Derrick and Shirley Shalanda
Create a Home Valuation Report for This Property
The Home Valuation Report is an in-depth analysis detailing your home's value as well as a comparison with similar homes in the area
Home Values in the Area
Average Home Value in this Area
Purchase History
| Date | Buyer | Sale Price | Title Company |
|---|---|---|---|
| Shirley Shalanda R | -- | None Available | |
| Shirley Derrick | $108,000 | -- |
Source: Public Records
Mortgage History
| Date | Status | Borrower | Loan Amount |
|---|---|---|---|
| Previous Owner | Shirley Derrick | $122,100 | |
| Previous Owner | Shirley Derrick | $132,000 | |
| Previous Owner | Shirley Derrick | $24,150 | |
| Previous Owner | Shirley Derrick | $126,000 |
Source: Public Records
Tax History Compared to Growth
Tax History
| Year | Tax Paid | Tax Assessment Tax Assessment Total Assessment is a certain percentage of the fair market value that is determined by local assessors to be the total taxable value of land and additions on the property. | Land | Improvement |
|---|---|---|---|---|
| 2024 | $5,838 | $84,672 | $5,292 | $79,380 |
| 2023 | $5,838 | $84,672 | $5,292 | $79,380 |
| 2022 | $5,838 | $84,672 | $5,292 | $79,380 |
| 2021 | $4,173 | $56,175 | $6,300 | $49,875 |
| 2020 | $4,173 | $56,175 | $6,300 | $49,875 |
| 2019 | $4,173 | $56,175 | $6,300 | $49,875 |
| 2018 | $4,033 | $54,281 | $6,087 | $48,194 |
| 2016 | $3,685 | $49,603 | $5,797 | $43,806 |
| 2015 | $3,510 | $47,247 | $5,522 | $41,725 |
| 2014 | $3,424 | $46,092 | $5,387 | $40,705 |
Source: Public Records
Map
Nearby Homes
- 157 Pembroke St Unit 159
- 144 Thomaston St
- 179 Manchester St
- 211 Holcomb St Unit 213
- 25 Cornwall St
- 355 Cornwall St Unit 357
- 90 Manchester St
- 111 Westbourne Pkwy Unit 113
- 86 Hartland St
- 165 Bloomfield Ave
- 181 Westbourne Pkwy
- 109 Blue Hills Ave
- 111 Bloomfield Ave
- 103 Baltimore St
- 150 Adams St Unit 152
- 152 Burnham St
- 243 Terry Rd
- 11 Pershing St Unit 13
- 171 N Canaan St
- 70 Burnham St Unit 72
- 373 Holcomb St
- 365 Holcomb St
- 361 Holcomb St
- 379 Holcomb St
- 254 Colebrook St
- 246 Colebrook St
- 357 Holcomb St
- 268 Granby St
- 385 Holcomb St
- 238 Colebrook St
- 262 Granby St
- 368 Holcomb St
- 374 Holcomb St
- 380 Holcomb St
- 349 Holcomb St
- 234 Colebrook St
- 362 Holcomb St
- 256 Granby St
- 358 Holcomb St
- 386 Holcomb St