
Seller's Agent in 2021
Mary Linda Cotten
Coldwell Banker Walden & Kirkland
(229) 347-0953
211 Total Sales


Estimated Value: $414,000 - $475,000
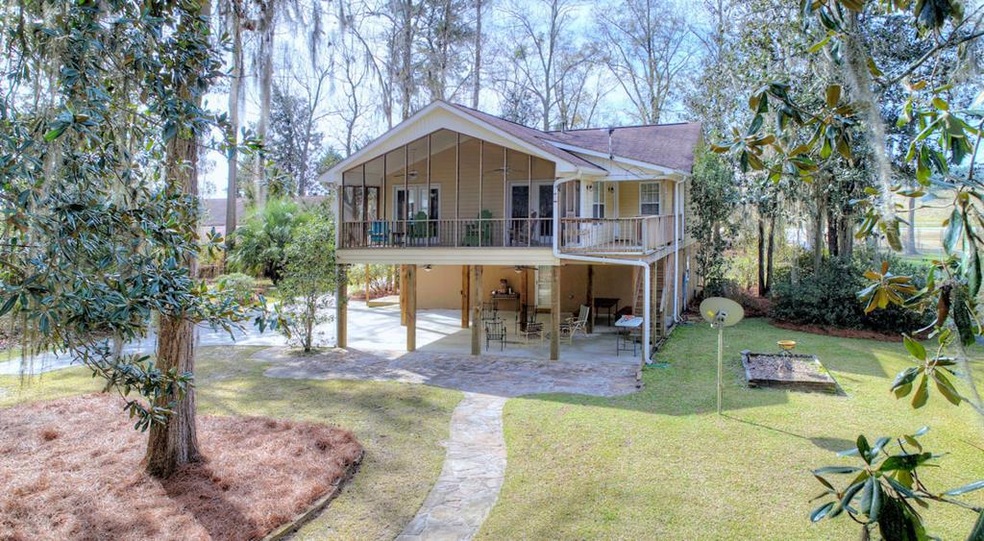
Fishing Paradise and Lakeside living at Lake Blackshear! This vacation retreat includes the furnished cottage, and the lot next door with 2000 square foot wired workshop for boat storage, a man cave and so much. Relax and Enjoy the cool lake breezes at the boat dock while catching a net full of fish. Open the door to charm that overlooks picturesque view of the lake and wooded ambience of the cypress and oak trees. The covered patio and screen porch emphasizes the casual life at the lake. Great room and the gourmet kitchen Big enough and open so everyone will be part of the entertaining. 3 large bedrooms and 2 baths on the second floor. On the first floor your own private kitchen/keeping room , and entertainment room and bedroom and bath perfect for another fun getaway.Celebrate Nature where mother nature is the major developer.. Abundant Sunshine and Verdant landscape becomes million dollar view and the ideal retreat for relaxation.
Last Agent to Sell the Property
Coldwell Banker Walden & Kirkland Brokerage Phone: 2294368811 License #281464 Listed on: 02/15/2021
| Date | Buyer | Sale Price | Title Company |
|---|---|---|---|
| Thomas John A | $265,000 | -- | |
| Gray Pamela A | $156,750 | -- | |
| Barnett Leslie C | $35,000 | -- |
| Date | Status | Borrower | Loan Amount |
|---|---|---|---|
| Open | Thomas John A | $100,000 | |
| Previous Owner | Gray Pamela A | $133,238 |
| Date | Event | Price | List to Sale | Price per Sq Ft |
|---|---|---|---|---|
| 03/31/2021 03/31/21 | Sold | $265,000 | -- | $107 / Sq Ft |
| 02/15/2021 02/15/21 | Pending | -- | -- | -- |
| Year | Tax Paid | Tax Assessment Tax Assessment Total Assessment is a certain percentage of the fair market value that is determined by local assessors to be the total taxable value of land and additions on the property. | Land | Improvement |
|---|---|---|---|---|
| 2025 | $4,419 | $202,045 | $74,412 | $127,633 |
| 2024 | $2,493 | $80,000 | $20,000 | $60,000 |
| 2023 | $2,493 | $80,000 | $20,000 | $60,000 |
| 2022 | $2,495 | $80,000 | $20,000 | $60,000 |
| 2021 | $2,361 | $74,162 | $20,000 | $54,162 |
| 2020 | $2,596 | $74,162 | $20,000 | $54,162 |
| 2019 | $1,965 | $82,242 | $28,080 | $54,162 |
| 2018 | $2,356 | $82,242 | $28,080 | $54,162 |
| 2017 | $2,356 | $82,242 | $28,080 | $54,162 |
| 2016 | $2,356 | $82,242 | $28,080 | $54,162 |
| 2015 | $2,304 | $82,242 | $28,080 | $54,162 |
| 2014 | $2,665 | $94,814 | $37,440 | $57,374 |
| 2013 | -- | $94,814 | $37,440 | $57,374 |
| 2012 | -- | $94,814 | $37,440 | $57,374 |
Seller's Agent in 2021
Mary Linda Cotten
Coldwell Banker Walden & Kirkland
(229) 347-0953
211 Total Sales
P
Buyer's Agent in 2021
Peggy Brown
Coldwell Banker Walden & Kirkland
(229) 894-4110
32 Total Sales
Source: Albany Board of REALTORS®
MLS Number: 146815
APN: OSC02-020-000
Ask me questions while you tour the home.