369 Mowry St Woonsocket, RI 02895
Bernon District NeighborhoodEstimated Value: $309,000 - $434,000
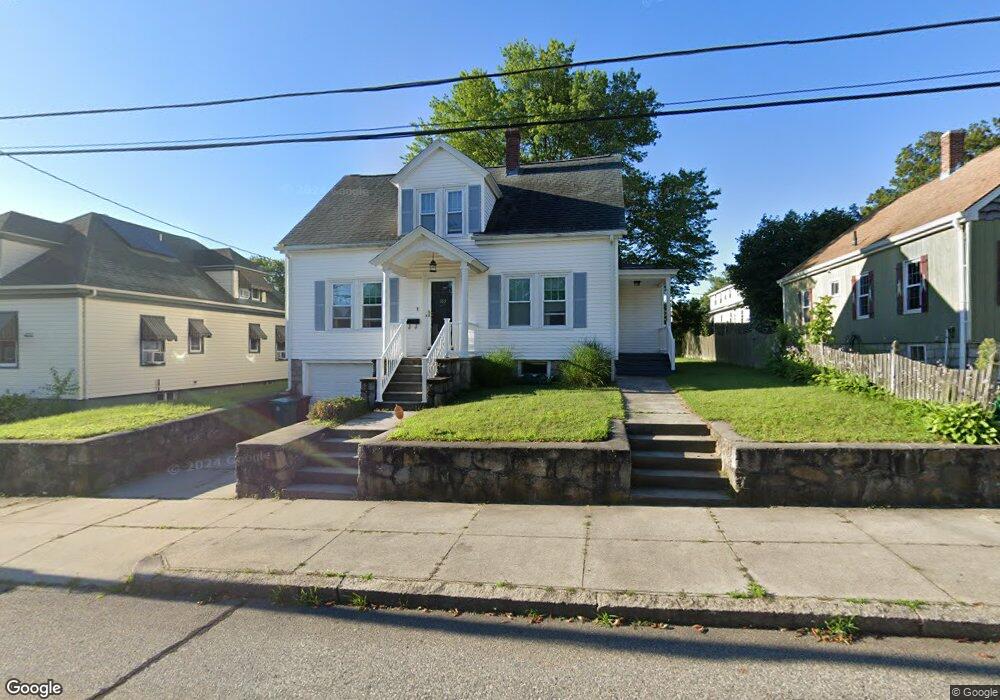
About This Home
This home is located at 369 Mowry St, Woonsocket, RI 02895 and is currently estimated at $366,921, approximately $257 per square foot. 369 Mowry St is a home located in Providence County with nearby schools including Woonsocket High School, Founders Academy, and Beacon Charter School.
Ownership History
We collect this data history from publicly available records. To have your information removed, we recommend requesting removal directly through your county’s website.
Purchase Details
Home Financials for this Owner
Home Financials are based on the most recent Mortgage that was taken out on this home.Purchase Details
Purchase Details
Purchase Details
Purchase Details
Purchase Details
Home Financials for this Owner
Home Financials are based on the most recent Mortgage that was taken out on this home.Home Values in the Area
Average Home Value in this Area
Purchase History
We collect this data history from publicly available records. To have your information removed, we recommend requesting removal directly through your county’s website.
| Date | Buyer | Sale Price | Title Company |
|---|---|---|---|
| $149,900 | -- | ||
| $83,843 | -- | ||
| $85,000 | -- | ||
| $119,212 | -- | ||
| $250,000 | -- | ||
| $203,500 | -- |
Mortgage History
We collect this data history from publicly available records. To have your information removed, we recommend requesting removal directly through your county’s website.
| Date | Status | Borrower | Loan Amount |
|---|---|---|---|
| Closed | $37,500 | ||
| Closed | $12,500 | ||
| Closed | $5,000 | ||
| Closed | $22,485 | ||
| Closed | $39,900 | ||
| Previous Owner | $300,000 | ||
| Previous Owner | $30,525 |
Tax History
We collect this data history from publicly available records. To have your information removed, we recommend requesting removal directly through your county’s website.
| Year | Tax Paid | Tax Assessment Tax Assessment Total Assessment is a certain percentage of the fair market value that is determined by local assessors to be the total taxable value of land and additions on the property. | Land | Improvement |
|---|---|---|---|---|
| 2025 | $4,124 | $367,200 | $104,300 | $262,900 |
| 2024 | $3,860 | $265,500 | $92,500 | $173,000 |
| 2023 | $3,712 | $265,500 | $92,500 | $173,000 |
| 2022 | $3,712 | $265,500 | $92,500 | $173,000 |
| 2021 | $3,897 | $164,100 | $56,300 | $107,800 |
| 2020 | $3,938 | $164,100 | $56,300 | $107,800 |
| 2018 | $3,952 | $164,100 | $56,300 | $107,800 |
| 2017 | $3,925 | $130,400 | $45,500 | $84,900 |
| 2016 | $4,152 | $130,400 | $45,500 | $84,900 |
| 2015 | $4,770 | $130,400 | $45,500 | $84,900 |
| 2014 | $4,640 | $129,100 | $50,000 | $79,100 |
Map
- 20 Oakton St
- 63 Blakeley St Unit 107
- 0 Irving Ave Unit 1414507
- 59 Cooper Ave
- 0 Cranston St
- 204 Ward St
- 195 Elmore Ave
- 77 Capwell Ave
- 637 Park Ave
- 122 Grand St
- 50 Jackson St
- 104 Jenckes St
- 471 Providence St
- 688 Providence St
- 304 Getchell Ave
- 219 Crawford St
- 651 Front St
- 0 Chester St
- 184 Avenue C Unit 1
- 184 Avenue C Unit 3
Ask me questions while you tour the home.