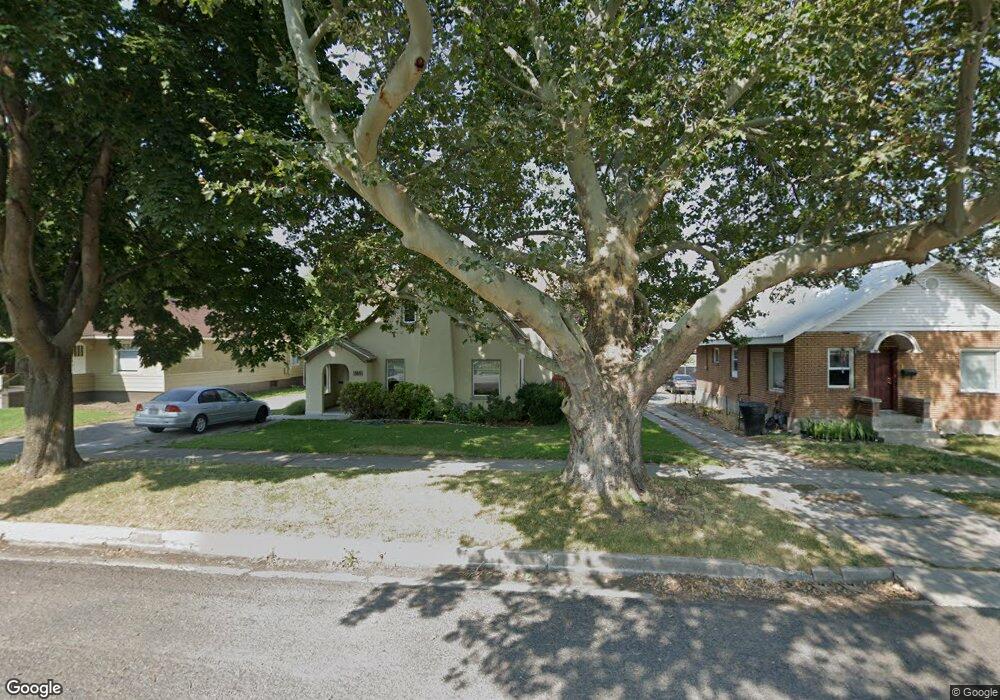
369 N 200 E Logan, UT 84321
Adams NeighborhoodEstimated Value: $423,706 - $549,000
Studio
--
Bath
1,933
Sq Ft
$239/Sq Ft
Est. Value
About This Home
This home is located at 369 N 200 E, Logan, UT 84321 and is currently estimated at $461,427, approximately $238 per square foot. 369 N 200 E is a home with nearby schools including Adams Elementary School, Mount Logan Middle School, and Logan High School.
Ownership History
Date
Name
Owned For
Owner Type
Purchase Details
Closed on
Jun 3, 2021
Sold by
Allen Anthony Jase
Bought by
All3n Llc
Current Estimated Value
Home Financials for this Owner
Home Financials are based on the most recent Mortgage that was taken out on this home.
Original Mortgage
$266,250
Outstanding Balance
$240,775
Interest Rate
3.1%
Mortgage Type
New Conventional
Estimated Equity
$220,652
Purchase Details
Closed on
May 22, 2021
Sold by
Simmons David M and Simmons Laurel T
Bought by
Allen Anthony Jase
Home Financials for this Owner
Home Financials are based on the most recent Mortgage that was taken out on this home.
Original Mortgage
$266,250
Outstanding Balance
$240,775
Interest Rate
3.1%
Mortgage Type
New Conventional
Estimated Equity
$220,652
Purchase Details
Closed on
Dec 17, 2010
Sold by
Taylor Nelson Rental Llc
Bought by
Simmons David and Simmons Laurel
Purchase Details
Closed on
Jun 28, 2002
Sold by
Taylor Nelson Rental Family Partnership
Bought by
Taylor Nelson Rental Llc
Create a Home Valuation Report for This Property
The Home Valuation Report is an in-depth analysis detailing your home's value as well as a comparison with similar homes in the area
Home Values in the Area
Average Home Value in this Area
Purchase History
| Date | Buyer | Sale Price | Title Company |
|---|---|---|---|
| All3n Llc | -- | None Available | |
| Allen Anthony Jase | -- | Hickman Land Title Logan | |
| Simmons David | -- | Cache Title Company | |
| Taylor Nelson Rental Llc | -- | -- |
Source: Public Records
Mortgage History
| Date | Status | Borrower | Loan Amount |
|---|---|---|---|
| Open | Allen Anthony Jase | $266,250 |
Source: Public Records
Tax History
| Year | Tax Paid | Tax Assessment Tax Assessment Total Assessment is a certain percentage of the fair market value that is determined by local assessors to be the total taxable value of land and additions on the property. | Land | Improvement |
|---|---|---|---|---|
| 2025 | $2,069 | $267,530 | $0 | $0 |
| 2024 | $2,124 | $266,085 | $0 | $0 |
| 2023 | $2,230 | $266,285 | $0 | $0 |
| 2022 | $2,387 | $266,110 | $0 | $0 |
| 2021 | $181 | $312,030 | $45,000 | $267,030 |
| 2020 | $1,615 | $250,408 | $45,000 | $205,408 |
| 2019 | $1,688 | $250,408 | $45,000 | $205,408 |
| 2018 | $1,687 | $228,400 | $45,000 | $183,400 |
| 2017 | $1,252 | $89,650 | $0 | $0 |
| 2016 | $1,298 | $85,250 | $0 | $0 |
| 2015 | $1,236 | $85,250 | $0 | $0 |
| 2014 | $1,117 | $85,250 | $0 | $0 |
| 2013 | -- | $85,250 | $0 | $0 |
Source: Public Records
Map
Nearby Homes
Your Personal Tour Guide
Ask me questions while you tour the home.