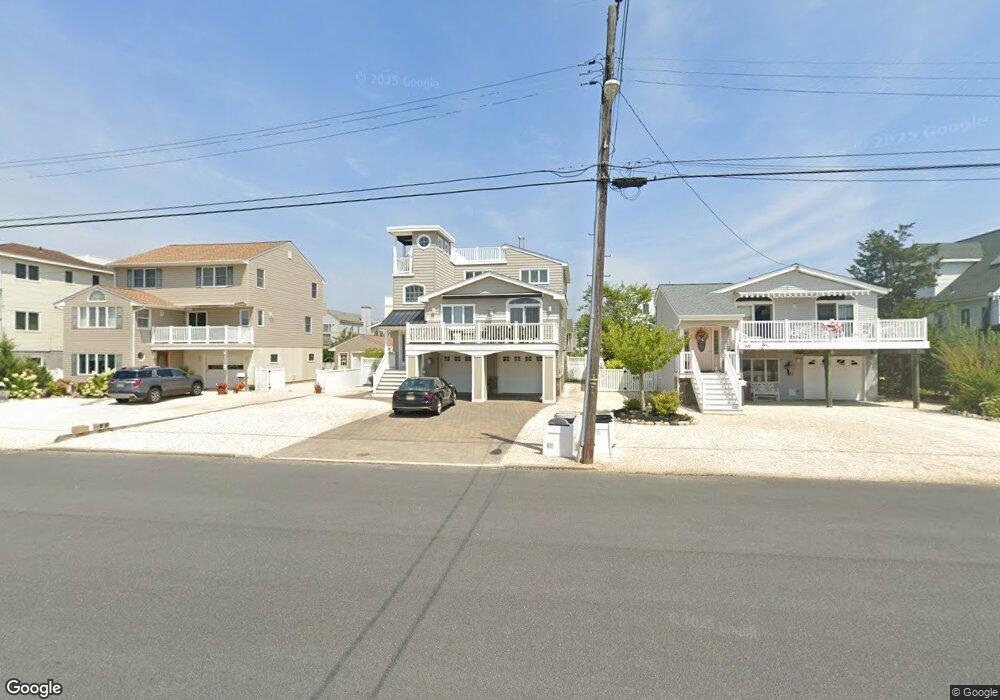
369 N 4th St Surf City, NJ 08008
Long Beach Island NeighborhoodEstimated Value: $1,844,000 - $2,046,000
5
Beds
4
Baths
2,144
Sq Ft
$908/Sq Ft
Est. Value
About This Home
This home is located at 369 N 4th St, Surf City, NJ 08008 and is currently estimated at $1,946,454, approximately $907 per square foot. 369 N 4th St is a home located in Ocean County with nearby schools including Ethel A. Jacobsen Elementary School, Long Beach Island Grade School, and Southern Regional Middle School.
Ownership History
Date
Name
Owned For
Owner Type
Purchase Details
Closed on
Jan 29, 2001
Current Estimated Value
Purchase Details
Closed on
Jan 14, 2000
Sold by
Hodgson William
Bought by
Mccullough Brian and Mc Cullough Lisa
Home Financials for this Owner
Home Financials are based on the most recent Mortgage that was taken out on this home.
Original Mortgage
$294,300
Interest Rate
7.91%
Purchase Details
Closed on
Apr 9, 1999
Sold by
Temme Joseph Frank and Robinson Dorothy Temme
Bought by
St Francis Roman Catholic Church
Create a Home Valuation Report for This Property
The Home Valuation Report is an in-depth analysis detailing your home's value as well as a comparison with similar homes in the area
Home Values in the Area
Average Home Value in this Area
Purchase History
| Date | Buyer | Sale Price | Title Company |
|---|---|---|---|
| -- | $16,100 | -- | |
| Mccullough Brian | $327,000 | -- | |
| St Francis Roman Catholic Church | -- | -- |
Source: Public Records
Mortgage History
| Date | Status | Borrower | Loan Amount |
|---|---|---|---|
| Previous Owner | Mccullough Brian | $294,300 |
Source: Public Records
Tax History
| Year | Tax Paid | Tax Assessment Tax Assessment Total Assessment is a certain percentage of the fair market value that is determined by local assessors to be the total taxable value of land and additions on the property. | Land | Improvement |
|---|---|---|---|---|
| 2025 | $10,219 | $958,600 | $430,000 | $528,600 |
| 2024 | $9,634 | $958,600 | $430,000 | $528,600 |
| 2023 | $9,394 | $958,600 | $430,000 | $528,600 |
| 2022 | $9,394 | $958,600 | $430,000 | $528,600 |
| 2021 | $8,647 | $958,600 | $430,000 | $528,600 |
| 2020 | $8,369 | $958,600 | $430,000 | $528,600 |
| 2019 | $8,349 | $958,600 | $430,000 | $528,600 |
| 2018 | $8,680 | $855,200 | $376,000 | $479,200 |
| 2017 | $8,532 | $830,000 | $376,000 | $454,000 |
| 2016 | $8,325 | $830,000 | $376,000 | $454,000 |
| 2015 | $7,985 | $830,000 | $376,000 | $454,000 |
| 2014 | $7,943 | $830,000 | $376,000 | $454,000 |
Source: Public Records
Map
Nearby Homes
- 329 W 5th St
- 615 S Barnegat Ave
- 294 N 2nd St
- 2572 E East Bay Ave
- 322 N 3rd St
- 354 W 11th St
- 22 Manning Dr
- 2 Northeast Dr
- 359 W 12th St
- 401 Boulevard Unit 306
- 401 Boulevard Unit 208
- 401 Boulevard Unit 203
- 401 Boulevard Unit 503
- 401 Boulevard Unit 205
- 401 Boulevard Unit 207
- 401 Boulevard Unit 202
- 401 Boulevard Unit 206
- 401 Boulevard Unit 204
- 2561 2nd St
- 352 N 5th St
Your Personal Tour Guide
Ask me questions while you tour the home.