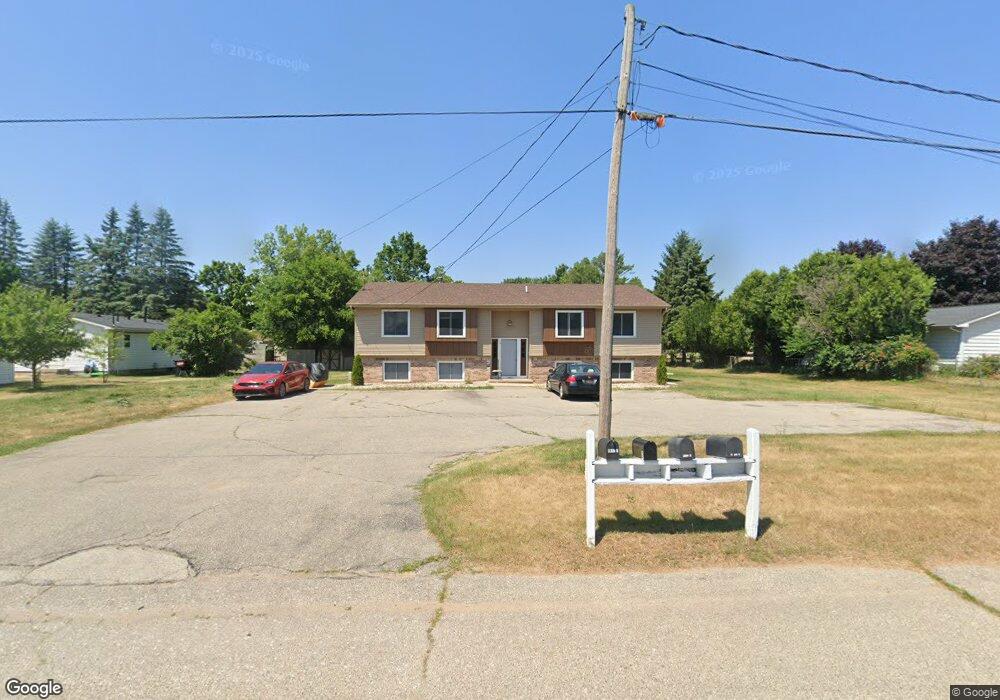
369 Pear St Cedar Springs, MI 49319
Estimated Value: $411,000 - $455,822
2
Beds
1
Bath
950
Sq Ft
$458/Sq Ft
Est. Value
About This Home
This home is located at 369 Pear St, Cedar Springs, MI 49319 and is currently estimated at $434,706, approximately $457 per square foot. 369 Pear St is a home located in Kent County with nearby schools including Cedar Trails Elementary School, Red Hawk Intermediate School, and Beach Elementary School.
Ownership History
Date
Name
Owned For
Owner Type
Purchase Details
Closed on
Apr 14, 2017
Sold by
Spitsbergen Daniel O and Spitsbergen Elizabeth
Bought by
Cedar Springs Holdings Company Llc
Current Estimated Value
Purchase Details
Closed on
Apr 4, 2017
Sold by
Cedar Holding Co Llc
Bought by
Spitsbergen Daniel O and Spitsbergen Elizabeth
Purchase Details
Closed on
Aug 24, 2005
Sold by
Spitsbergen Daniel O and Spitsbergen Elizabeth
Bought by
Cedar Holdings Co Llc
Purchase Details
Closed on
Jun 26, 2003
Sold by
Cedar Holding Company Llc
Bought by
Spitsbergen Daniel O and Spitsbergen Elizabeth
Home Financials for this Owner
Home Financials are based on the most recent Mortgage that was taken out on this home.
Original Mortgage
$116,400
Interest Rate
5.36%
Mortgage Type
Purchase Money Mortgage
Purchase Details
Closed on
Oct 1, 1998
Bought by
Spitsbergen Daniel O and Cedar Holding Company Llc
Create a Home Valuation Report for This Property
The Home Valuation Report is an in-depth analysis detailing your home's value as well as a comparison with similar homes in the area
Home Values in the Area
Average Home Value in this Area
Purchase History
| Date | Buyer | Sale Price | Title Company |
|---|---|---|---|
| Cedar Springs Holdings Company Llc | -- | None Available | |
| Spitsbergen Daniel O | -- | None Available | |
| Cedar Holdings Co Llc | -- | -- | |
| Spitsbergen Daniel O | -- | -- | |
| Spitsbergen Daniel O | $155,000 | -- |
Source: Public Records
Mortgage History
| Date | Status | Borrower | Loan Amount |
|---|---|---|---|
| Previous Owner | Spitsbergen Daniel O | $116,400 |
Source: Public Records
Tax History Compared to Growth
Tax History
| Year | Tax Paid | Tax Assessment Tax Assessment Total Assessment is a certain percentage of the fair market value that is determined by local assessors to be the total taxable value of land and additions on the property. | Land | Improvement |
|---|---|---|---|---|
| 2025 | $4,735 | $203,300 | $0 | $0 |
| 2024 | $4,735 | $197,200 | $0 | $0 |
| 2023 | $4,510 | $158,200 | $0 | $0 |
| 2022 | $4,486 | $128,100 | $0 | $0 |
| 2021 | $4,420 | $112,800 | $0 | $0 |
| 2020 | $4,243 | $90,000 | $0 | $0 |
| 2019 | $4,132 | $66,200 | $0 | $0 |
| 2018 | $4,119 | $67,800 | $0 | $0 |
| 2017 | $4,015 | $65,800 | $0 | $0 |
| 2016 | $3,923 | $63,700 | $0 | $0 |
| 2015 | -- | $63,700 | $0 | $0 |
| 2013 | -- | $61,900 | $0 | $0 |
Source: Public Records
Map
Nearby Homes
- 340 West St
- 295 8th St NE
- 373 Cedar St NE
- 260 Pear St NE
- 4398 17 Mile Rd NE
- 69 S Main
- 139 N 5th St NE
- 71 N 2nd St NE
- 115 E Cherry St NE
- 281 Ronald St NE
- 224 Ann St NE
- 197 E Elm St
- 361 Ronald St NE
- 5069 Dio Dr
- 369 E Muskegon St
- 322 E Ash St NE
- 249 Maple
- 520 Needlewood Dr
- 490 Pioneer Trail
- 13671 Starflower