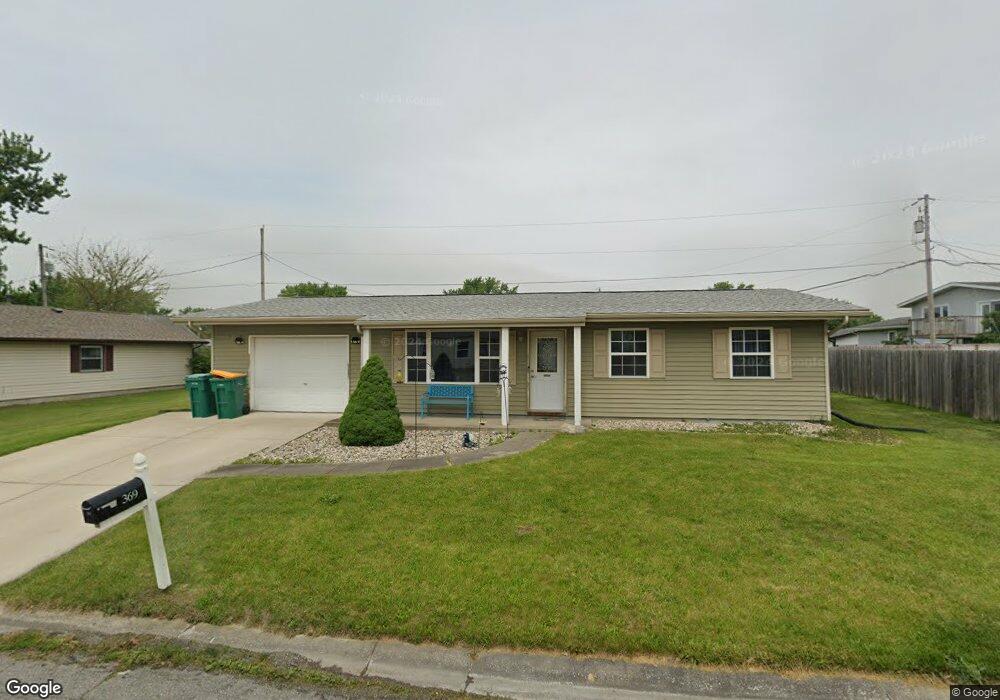
369 Salt Creek Pkwy Valparaiso, IN 46385
Estimated Value: $196,000 - $231,000
3
Beds
2
Baths
1,064
Sq Ft
$206/Sq Ft
Est. Value
About This Home
This home is located at 369 Salt Creek Pkwy, Valparaiso, IN 46385 and is currently estimated at $219,438, approximately $206 per square foot. 369 Salt Creek Pkwy is a home located in Porter County with nearby schools including Union Township Middle School, Wheeler High School, and Emmanuel Baptist Academy.
Ownership History
Date
Name
Owned For
Owner Type
Purchase Details
Closed on
May 7, 2010
Sold by
Gore R Todd R and Gore Joseph D
Bought by
Wright Chad A and Wright Ashlee V
Current Estimated Value
Home Financials for this Owner
Home Financials are based on the most recent Mortgage that was taken out on this home.
Original Mortgage
$109,872
Interest Rate
5.25%
Mortgage Type
FHA
Purchase Details
Closed on
Mar 19, 2010
Sold by
Gore R Todd R and Gore Joseph D
Bought by
Gore Construction Corp
Home Financials for this Owner
Home Financials are based on the most recent Mortgage that was taken out on this home.
Original Mortgage
$109,872
Interest Rate
5.25%
Mortgage Type
FHA
Purchase Details
Closed on
Jun 9, 2009
Sold by
Jpmorgan Chase Bank National Association
Bought by
Gore Joseph D
Purchase Details
Closed on
Mar 11, 2009
Sold by
Heidenreich Steven L and Heidenreich Deanna L
Bought by
Jpmorgan Chase Bank National Association
Create a Home Valuation Report for This Property
The Home Valuation Report is an in-depth analysis detailing your home's value as well as a comparison with similar homes in the area
Home Values in the Area
Average Home Value in this Area
Purchase History
| Date | Buyer | Sale Price | Title Company |
|---|---|---|---|
| Wright Chad A | -- | Ticor Title Insurance | |
| Gore Construction Corp | -- | Ticor Title Ins | |
| Gore Joseph D | $60,000 | Service Link | |
| Jpmorgan Chase Bank National Association | $79,900 | None Available |
Source: Public Records
Mortgage History
| Date | Status | Borrower | Loan Amount |
|---|---|---|---|
| Previous Owner | Wright Chad A | $109,872 | |
| Previous Owner | Gore Construction Corp | $83,806 |
Source: Public Records
Tax History Compared to Growth
Tax History
| Year | Tax Paid | Tax Assessment Tax Assessment Total Assessment is a certain percentage of the fair market value that is determined by local assessors to be the total taxable value of land and additions on the property. | Land | Improvement |
|---|---|---|---|---|
| 2024 | $1,428 | $213,900 | $32,600 | $181,300 |
| 2023 | $1,355 | $194,500 | $29,200 | $165,300 |
| 2022 | $1,355 | $180,600 | $29,200 | $151,400 |
| 2021 | $1,083 | $149,800 | $29,200 | $120,600 |
| 2020 | $988 | $137,000 | $25,400 | $111,600 |
| 2019 | $913 | $128,400 | $25,400 | $103,000 |
| 2018 | $894 | $120,500 | $25,400 | $95,100 |
| 2017 | $827 | $124,100 | $25,400 | $98,700 |
| 2016 | $657 | $112,800 | $25,000 | $87,800 |
| 2014 | $667 | $108,600 | $23,800 | $84,800 |
| 2013 | -- | $104,700 | $24,500 | $80,200 |
Source: Public Records
Map
Nearby Homes
- 364 Rainier Rd
- 532 Sassafrass Ct
- 384 Sassafras Dr
- 387 Sassafras Dr
- 397 Sassafras Dr
- 520 Sunshine Dr
- 403 Sequoia Dr
- 385 Riviera Ct
- 375 Sassafras Dr
- 424A Salt Creek Pkwy
- 542 Robyn Rd
- 543 N 325 W
- 493 N 325 W
- 503 N State Road 149
- 611 N 450 W
- 628 Old Forge Rd
- 631 Osage Rd
- 637 Old Forge Rd
- 640 Old Forge Rd
- 562 Glenwood Dr
- 371 Salt Creek Pkwy
- 515 Salt Creek Ct
- 517 Salt Creek Ct
- 370 Salt Creek Pkwy
- 368 Salt Creek Pkwy
- 372 Salt Creek Pkwy
- 366 Salt Creek Pkwy
- 519 Salt Creek Ct
- 378 Sandalwood Dr
- 374 Salt Creek Pkwy
- 364 Salt Creek Pkwy
- 514 Salt Creek Ct
- 380 Sandalwood Dr
- 521 Salt Creek Ct
- 516 Salt Creek Ct
- C Salt Creek Pkwy
- -E Salt Creek Pkwy
- 518 Salt Creek Ct
- 376 Salt Creek Pkwy
- 382 Sandalwood Dr