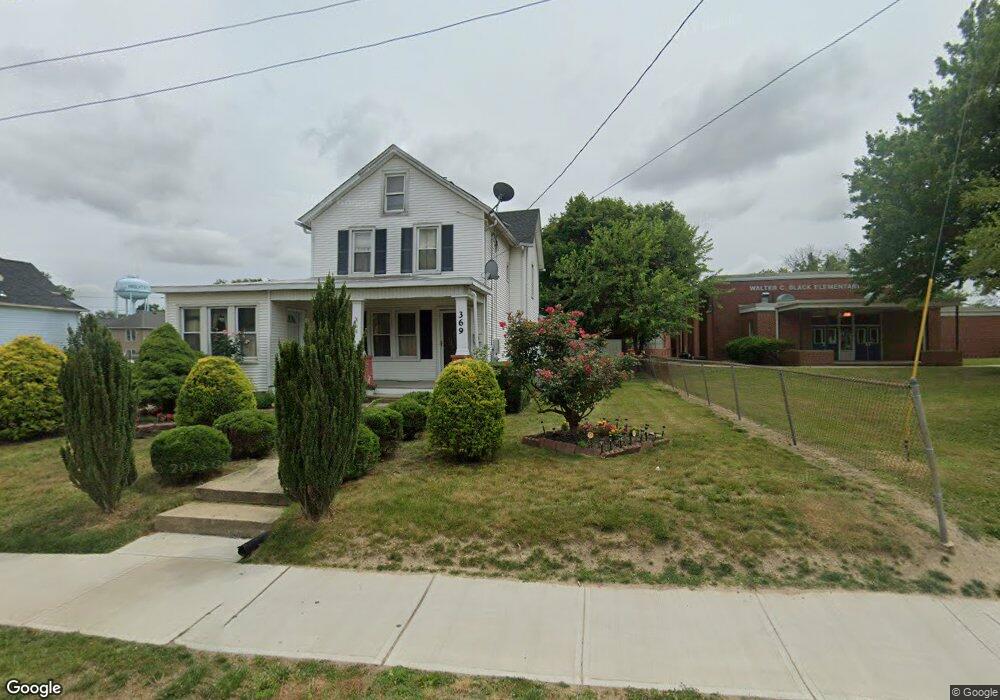
369 Stockton St Hightstown, NJ 08520
Estimated Value: $506,000 - $593,000
--
Bed
--
Bath
1,998
Sq Ft
$272/Sq Ft
Est. Value
About This Home
This home is located at 369 Stockton St, Hightstown, NJ 08520 and is currently estimated at $543,845, approximately $272 per square foot. 369 Stockton St is a home located in Mercer County with nearby schools including Melvin H. Kreps Middle School, Hightstown High School, and SciCore Academy.
Ownership History
Date
Name
Owned For
Owner Type
Purchase Details
Closed on
May 24, 2001
Sold by
Shalack Robert
Bought by
Torres Hector and Transito Torres
Current Estimated Value
Home Financials for this Owner
Home Financials are based on the most recent Mortgage that was taken out on this home.
Original Mortgage
$156,750
Outstanding Balance
$58,747
Interest Rate
7.08%
Estimated Equity
$485,098
Purchase Details
Closed on
Mar 2, 1992
Sold by
Shalack Robert E
Bought by
Shalack Robert E and Shalack Chantell,L
Purchase Details
Closed on
Dec 26, 1989
Sold by
Barclay Jr Albert C and Barclay Margaret K
Bought by
Shalack Robert E
Create a Home Valuation Report for This Property
The Home Valuation Report is an in-depth analysis detailing your home's value as well as a comparison with similar homes in the area
Home Values in the Area
Average Home Value in this Area
Purchase History
| Date | Buyer | Sale Price | Title Company |
|---|---|---|---|
| Torres Hector | $165,000 | -- | |
| Shalack Robert E | -- | -- | |
| Shalack Robert E | $154,000 | -- |
Source: Public Records
Mortgage History
| Date | Status | Borrower | Loan Amount |
|---|---|---|---|
| Open | Torres Hector | $156,750 |
Source: Public Records
Tax History Compared to Growth
Tax History
| Year | Tax Paid | Tax Assessment Tax Assessment Total Assessment is a certain percentage of the fair market value that is determined by local assessors to be the total taxable value of land and additions on the property. | Land | Improvement |
|---|---|---|---|---|
| 2025 | $12,120 | $247,200 | $76,300 | $170,900 |
| 2024 | $11,997 | $247,200 | $76,300 | $170,900 |
| 2023 | $11,997 | $247,200 | $76,300 | $170,900 |
| 2022 | $11,581 | $247,200 | $76,300 | $170,900 |
| 2021 | $10,762 | $238,300 | $76,300 | $162,000 |
| 2020 | $10,516 | $238,300 | $76,300 | $162,000 |
| 2019 | $10,223 | $238,300 | $76,300 | $162,000 |
| 2018 | $9,925 | $238,300 | $76,300 | $162,000 |
| 2017 | $9,823 | $238,300 | $76,300 | $162,000 |
| 2016 | $9,737 | $238,300 | $76,300 | $162,000 |
| 2015 | $9,675 | $238,300 | $76,300 | $162,000 |
| 2014 | $9,737 | $238,300 | $76,300 | $162,000 |
Source: Public Records
Map
Nearby Homes