Estimated Value: $364,000 - $366,000
4
Beds
2
Baths
1,989
Sq Ft
$184/Sq Ft
Est. Value
About This Home
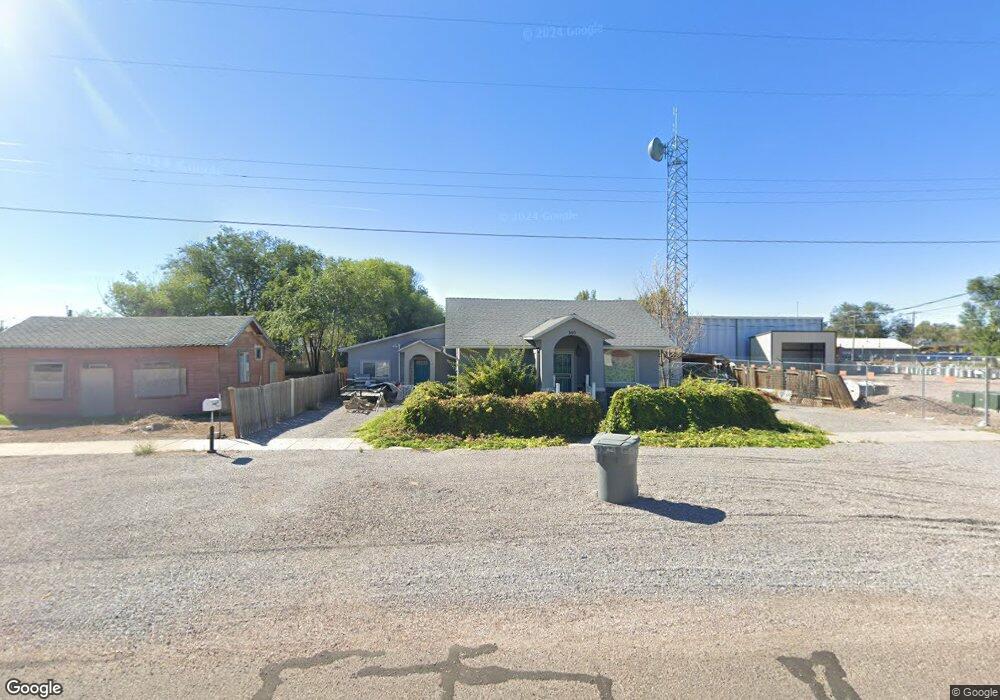
This home is located at 369 W 100 N, Delta, UT 84624 and is currently estimated at $365,000, approximately $183 per square foot. 369 W 100 N is a home located in Millard County with nearby schools including Cba Center and White River Academy.
Ownership History
Date
Name
Owned For
Owner Type
Purchase Details
Closed on
Jan 24, 2018
Sold by
Goodman Shari and Miller Arlinda
Bought by
Corbett Aspen D
Current Estimated Value
Home Financials for this Owner
Home Financials are based on the most recent Mortgage that was taken out on this home.
Original Mortgage
$103,500
Outstanding Balance
$87,115
Interest Rate
3.93%
Mortgage Type
New Conventional
Estimated Equity
$277,885
Purchase Details
Closed on
Jan 22, 2018
Sold by
Bishop Garn M
Bought by
Goodman Shari
Home Financials for this Owner
Home Financials are based on the most recent Mortgage that was taken out on this home.
Original Mortgage
$103,500
Outstanding Balance
$87,115
Interest Rate
3.93%
Mortgage Type
New Conventional
Estimated Equity
$277,885
Create a Home Valuation Report for This Property
The Home Valuation Report is an in-depth analysis detailing your home's value as well as a comparison with similar homes in the area
Home Values in the Area
Average Home Value in this Area
Purchase History
| Date | Buyer | Sale Price | Title Company |
|---|---|---|---|
| Corbett Aspen D | -- | First American Title | |
| Goodman Shari | -- | -- |
Source: Public Records
Mortgage History
| Date | Status | Borrower | Loan Amount |
|---|---|---|---|
| Open | Corbett Aspen D | $103,500 |
Source: Public Records
Tax History Compared to Growth
Tax History
| Year | Tax Paid | Tax Assessment Tax Assessment Total Assessment is a certain percentage of the fair market value that is determined by local assessors to be the total taxable value of land and additions on the property. | Land | Improvement |
|---|---|---|---|---|
| 2025 | $1,624 | $173,665 | $16,211 | $157,454 |
| 2024 | $1,624 | $149,280 | $12,269 | $137,011 |
| 2023 | $1,849 | $149,280 | $12,269 | $137,011 |
| 2022 | $1,461 | $109,916 | $12,826 | $97,090 |
| 2021 | $1,239 | $88,955 | $9,698 | $79,257 |
| 2020 | $1,010 | $72,076 | $8,817 | $63,259 |
| 2019 | $892 | $63,667 | $8,164 | $55,503 |
| 2018 | $821 | $59,085 | $8,164 | $50,921 |
| 2017 | $2 | $58,847 | $7,926 | $50,921 |
| 2016 | -- | $58,847 | $7,926 | $50,921 |
| 2015 | -- | $58,847 | $7,926 | $50,921 |
| 2014 | -- | $41,123 | $7,941 | $33,182 |
| 2013 | -- | $41,123 | $7,941 | $33,182 |
Source: Public Records
Map
Nearby Homes