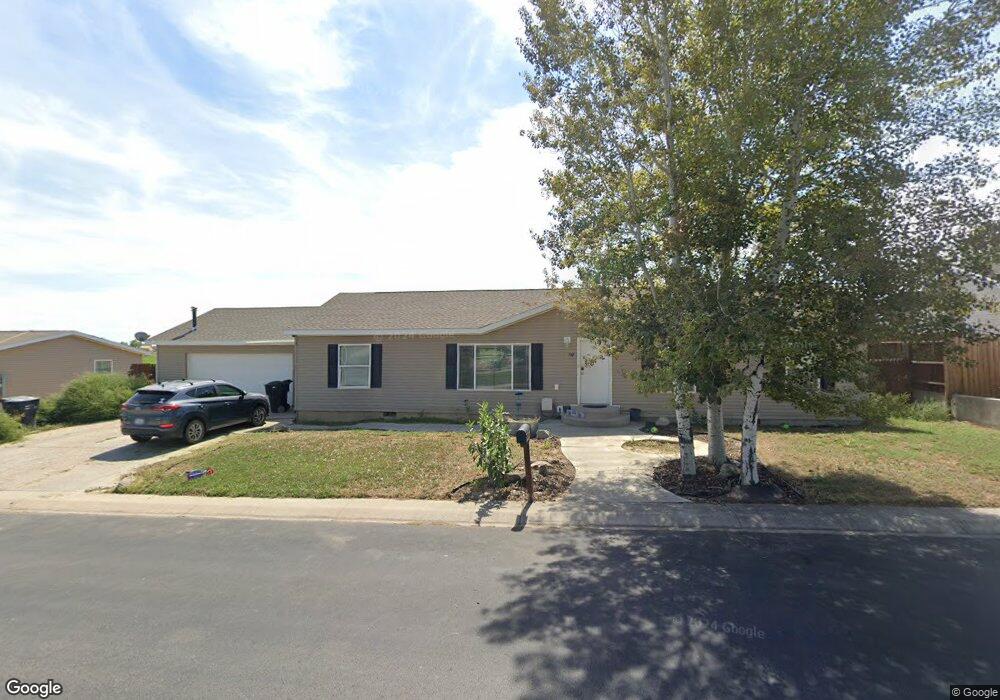
369 W 2100 S Vernal, UT 84078
Estimated Value: $281,000 - $314,000
3
Beds
2
Baths
1,620
Sq Ft
$188/Sq Ft
Est. Value
About This Home
This home is located at 369 W 2100 S, Vernal, UT 84078 and is currently estimated at $304,071, approximately $187 per square foot. 369 W 2100 S is a home located in Uintah County with nearby schools including Discovery School, Vernal Middle School, and Uintah Middle School.
Ownership History
Date
Name
Owned For
Owner Type
Purchase Details
Closed on
Apr 20, 2010
Sold by
Federal National Mortgage Association
Bought by
Davis Kagen
Current Estimated Value
Home Financials for this Owner
Home Financials are based on the most recent Mortgage that was taken out on this home.
Original Mortgage
$103,098
Outstanding Balance
$70,346
Interest Rate
5.5%
Mortgage Type
FHA
Estimated Equity
$233,725
Purchase Details
Closed on
Sep 22, 2009
Sold by
Trollip Mark J
Bought by
Federal National Mortgage Association
Purchase Details
Closed on
Jun 12, 2007
Sold by
Trollip Mark J
Bought by
Trollip Mark J and Trollip Jolene
Home Financials for this Owner
Home Financials are based on the most recent Mortgage that was taken out on this home.
Original Mortgage
$163,000
Interest Rate
6.16%
Mortgage Type
New Conventional
Create a Home Valuation Report for This Property
The Home Valuation Report is an in-depth analysis detailing your home's value as well as a comparison with similar homes in the area
Home Values in the Area
Average Home Value in this Area
Purchase History
| Date | Buyer | Sale Price | Title Company |
|---|---|---|---|
| Davis Kagen | -- | -- | |
| Federal National Mortgage Association | -- | -- | |
| Trollip Mark J | -- | -- | |
| Trollip Mark J | -- | -- |
Source: Public Records
Mortgage History
| Date | Status | Borrower | Loan Amount |
|---|---|---|---|
| Open | Davis Kagen | $103,098 | |
| Previous Owner | Trollip Mark J | $163,000 |
Source: Public Records
Tax History Compared to Growth
Tax History
| Year | Tax Paid | Tax Assessment Tax Assessment Total Assessment is a certain percentage of the fair market value that is determined by local assessors to be the total taxable value of land and additions on the property. | Land | Improvement |
|---|---|---|---|---|
| 2024 | $1,418 | $168,768 | $11,400 | $157,368 |
| 2023 | $1,418 | $123,830 | $10,930 | $112,900 |
| 2022 | $969 | $93,944 | $10,930 | $83,014 |
| 2021 | $1,000 | $79,537 | $10,930 | $68,607 |
| 2020 | $974 | $79,537 | $10,930 | $68,607 |
| 2019 | $846 | $68,265 | $11,000 | $57,265 |
| 2018 | $727 | $58,721 | $11,000 | $47,721 |
| 2017 | $7 | $58,721 | $11,000 | $47,721 |
| 2016 | $871 | $77,280 | $11,000 | $66,280 |
| 2015 | $802 | $77,280 | $11,000 | $66,280 |
| 2014 | $793 | $77,280 | $11,000 | $66,280 |
| 2013 | $777 | $74,124 | $11,000 | $63,124 |
Source: Public Records
Map
Nearby Homes