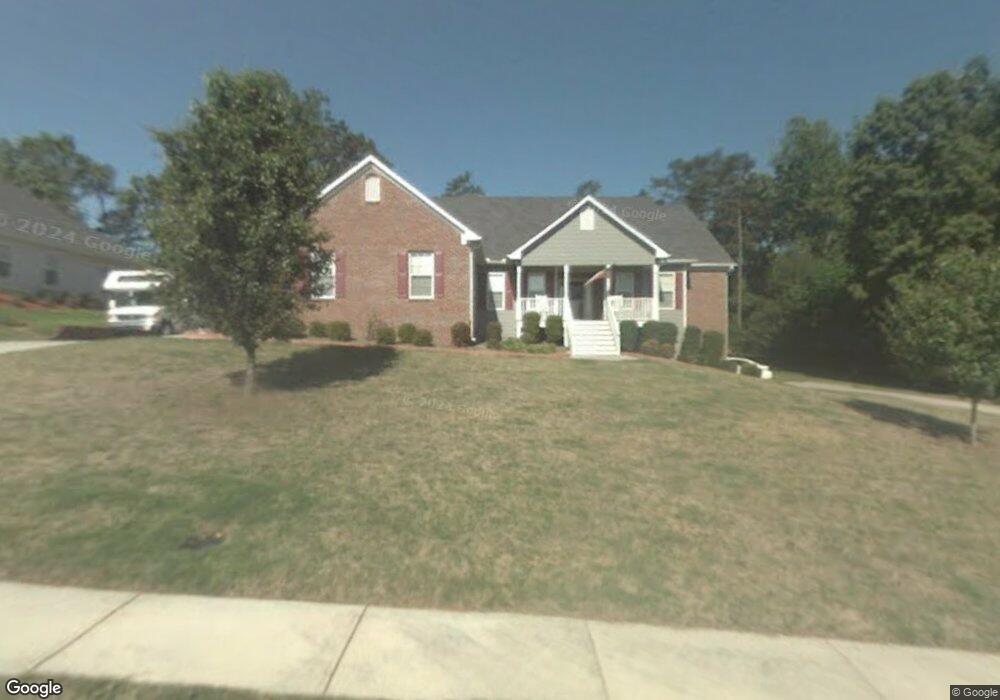
3690 Arden Creek Ct SE Bethlehem, GA 30620
Estimated Value: $415,000 - $448,034
4
Beds
3
Baths
3,504
Sq Ft
$123/Sq Ft
Est. Value
About This Home
This home is located at 3690 Arden Creek Ct SE, Bethlehem, GA 30620 and is currently estimated at $432,509, approximately $123 per square foot. 3690 Arden Creek Ct SE is a home located in Gwinnett County with nearby schools including Harbins Elementary School, McConnell Middle School, and Archer High School.
Ownership History
Date
Name
Owned For
Owner Type
Purchase Details
Closed on
Mar 19, 2018
Sold by
Strickland John T
Bought by
Nash Bethany and Bird Jason
Current Estimated Value
Home Financials for this Owner
Home Financials are based on the most recent Mortgage that was taken out on this home.
Original Mortgage
$223,600
Outstanding Balance
$190,770
Interest Rate
4.38%
Mortgage Type
New Conventional
Estimated Equity
$241,739
Purchase Details
Closed on
Feb 21, 2014
Sold by
Strickland Angela L
Bought by
Strickland John T
Home Financials for this Owner
Home Financials are based on the most recent Mortgage that was taken out on this home.
Original Mortgage
$156,000
Interest Rate
4.43%
Mortgage Type
New Conventional
Purchase Details
Closed on
Nov 13, 2000
Sold by
Hal Craig Homes
Bought by
Strickland John T and Strickland Angela L
Home Financials for this Owner
Home Financials are based on the most recent Mortgage that was taken out on this home.
Original Mortgage
$134,320
Interest Rate
7.82%
Mortgage Type
New Conventional
Create a Home Valuation Report for This Property
The Home Valuation Report is an in-depth analysis detailing your home's value as well as a comparison with similar homes in the area
Home Values in the Area
Average Home Value in this Area
Purchase History
| Date | Buyer | Sale Price | Title Company |
|---|---|---|---|
| Nash Bethany | $279,500 | -- | |
| Strickland John T | -- | -- | |
| Strickland John T | $201,900 | -- | |
| Hal Craig Homes | $25,000 | -- |
Source: Public Records
Mortgage History
| Date | Status | Borrower | Loan Amount |
|---|---|---|---|
| Open | Nash Bethany | $223,600 | |
| Previous Owner | Strickland John T | $156,000 | |
| Previous Owner | Hal Craig Homes | $134,320 |
Source: Public Records
Tax History Compared to Growth
Tax History
| Year | Tax Paid | Tax Assessment Tax Assessment Total Assessment is a certain percentage of the fair market value that is determined by local assessors to be the total taxable value of land and additions on the property. | Land | Improvement |
|---|---|---|---|---|
| 2025 | $4,635 | $197,280 | $33,000 | $164,280 |
| 2024 | $4,763 | $149,720 | $30,360 | $119,360 |
| 2023 | $4,763 | $149,720 | $30,360 | $119,360 |
| 2022 | $4,119 | $167,800 | $30,360 | $137,440 |
| 2021 | $4,164 | $120,360 | $22,000 | $98,360 |
| 2020 | $4,191 | $120,360 | $22,000 | $98,360 |
| 2019 | $3,880 | $111,800 | $19,800 | $92,000 |
| 2018 | $3,300 | $88,240 | $24,120 | $64,120 |
| 2016 | $3,121 | $80,480 | $15,960 | $64,520 |
| 2015 | $3,142 | $80,480 | $15,960 | $64,520 |
| 2014 | -- | $80,480 | $15,960 | $64,520 |
Source: Public Records
Map
Nearby Homes
- 3685 Arden Creek Ct
- 2410 Ames St
- 3042 Lowell Rd
- 3550 Topeka Springs Trail
- 3424 Pratt Way
- 3344 Pratt Way
- 3893 Indian Shoals Rd SE
- 2060 Marlborough Dr
- 2671 Harbins Rd SE
- 3001 Saratoga Sky Way
- 3383 Arabian Farm Ln
- 3894 Saddle Bag Ct
- 2422 Snowshoe Bend
- 740 Patrick Mill Rd SW
- 2412 Snowshoe Bend
- Burton Plan at Bold Springs Farm
- 2102 Cayman Ct
- 3090 Newell Dr
- 3442 Flat Run Dr Unit 1
- 3442 Flat Run Dr SE
- 3690 Arden Creek Ct
- 3680 Arden Creek Ct
- 3670 Arden Creek Ct
- 3675 Arden Creek Ct
- 3660 Arden Creek Ct
- 2215 Arden Creek Dr
- 2235 Arden Creek Dr
- 3650 Arden Creek Ct
- 3720 Arden Creek Ct
- 3730 Arden Creek Ct SE
- 3730 Arden Creek Ct
- 3655 Arden Creek Ct
- 2200 Arden Creek Dr
- 3740 Arden Creek Ct
- 3655 Arden Creek Ct SE
- 3640 Arden Creek Ct
- 2255 Arden Creek Dr
- 2210 Arden Creek Dr
- 3750 Arden Creek Ct
- 2255R Arden Creek Dr