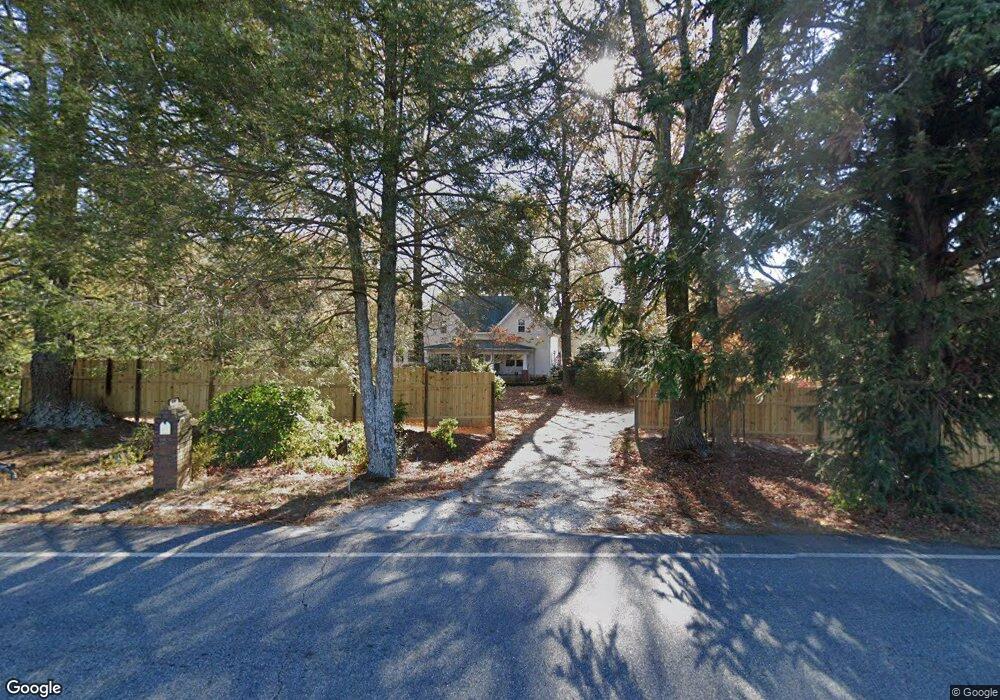
3690 Level Grove Rd Cornelia, GA 30531
Estimated Value: $260,000 - $521,000
2
Beds
2
Baths
2,448
Sq Ft
$168/Sq Ft
Est. Value
About This Home
This home is located at 3690 Level Grove Rd, Cornelia, GA 30531 and is currently estimated at $410,671, approximately $167 per square foot. 3690 Level Grove Rd is a home located in Habersham County with nearby schools including Level Grove Elementary School, South Habersham Middle School, and Habersham Success Academy.
Ownership History
Date
Name
Owned For
Owner Type
Purchase Details
Closed on
Apr 1, 2021
Sold by
Limehouse Richard R
Bought by
Strike Terrie
Current Estimated Value
Purchase Details
Closed on
Apr 22, 2019
Sold by
Lahayne Richard Justin
Bought by
Limehouse Richard R
Purchase Details
Closed on
Jun 15, 2018
Sold by
Short James C
Bought by
Welborn Evelyn S
Purchase Details
Closed on
Feb 5, 2018
Sold by
Short Susan Hardy
Bought by
Short James C
Purchase Details
Closed on
Dec 14, 2017
Sold by
Short Susan H
Bought by
Lahayne Richard Justin and Lahayne Cathy B
Purchase Details
Closed on
May 17, 2017
Sold by
Welborn Evelyn S
Bought by
Hardy William Henry
Purchase Details
Closed on
Apr 2, 2014
Sold by
Short Susan H
Bought by
Hardy William Henry
Create a Home Valuation Report for This Property
The Home Valuation Report is an in-depth analysis detailing your home's value as well as a comparison with similar homes in the area
Home Values in the Area
Average Home Value in this Area
Purchase History
| Date | Buyer | Sale Price | Title Company |
|---|---|---|---|
| Strike Terrie | $225,000 | -- | |
| Limehouse Richard R | $125,000 | -- | |
| Welborn Evelyn S | -- | -- | |
| Short James C | -- | -- | |
| Gator Properties Llc | $210,000 | -- | |
| Lahayne Richard Justin | $117,000 | -- | |
| Hardy William Henry | -- | -- | |
| Hardy William Henry | -- | -- |
Source: Public Records
Tax History
| Year | Tax Paid | Tax Assessment Tax Assessment Total Assessment is a certain percentage of the fair market value that is determined by local assessors to be the total taxable value of land and additions on the property. | Land | Improvement |
|---|---|---|---|---|
| 2025 | $1,275 | $143,610 | $45,843 | $97,767 |
| 2024 | -- | $143,820 | $22,708 | $121,112 |
| 2023 | $1,036 | $119,468 | $18,352 | $101,116 |
| 2022 | $1,029 | $89,096 | $9,940 | $79,156 |
| 2021 | $1,664 | $64,092 | $9,940 | $54,152 |
| 2020 | $1,273 | $47,340 | $9,940 | $37,400 |
| 2019 | $1,206 | $44,792 | $9,940 | $34,852 |
| 2018 | $1,183 | $44,296 | $9,940 | $34,356 |
| 2017 | $659 | $24,544 | $7,648 | $16,896 |
| 2016 | $640 | $61,360 | $7,648 | $16,896 |
| 2015 | $632 | $61,360 | $7,648 | $16,896 |
| 2014 | $644 | $61,360 | $7,648 | $16,896 |
| 2013 | -- | $25,308 | $8,412 | $16,896 |
Source: Public Records
Map
Nearby Homes
- 263 Woodmont Dr
- 0 Woodmont Dr Unit LOT 3
- 0 Beachwood Dr Unit 7694240
- 0 Beachwood Dr Unit 35
- 0 Hubert Harris
- J Warren
- 429 Hubert Harris Rd
- 255 Laurel Place Dr
- 0 J Warren Rd Unit 10429700
- 3402 Bc Grant Rd
- 0 State Route 365 Unit 10496178
- 0 State Route 365 Unit 10496183
- 490 Magnolia Grove Place
- 484 Magnolia Grove Place
- 335 Highland Pointe Dr
- 424 Highland Pointe Dr
- 226 Highland Pointe Dr
- 554 Creek Rd
- 524 Creek Rd
- 769 Dawn Place
- 3680 Level Grove Rd
- 3732 Level Grove Rd
- 3615 Level Grove Rd
- 3770 Level Grove Rd
- 645 Cherry Cir
- 3795 Level Grove Rd
- 3825 Level Grove Rd
- 3815 Level Grove Rd
- 639 Cherry Cir
- 3819 Level Grove Rd
- 3842 Level Grove Rd
- 629 Cherry Cir
- 3489 Level Grove Rd
- 3845 Level Grove Rd
- 578 Cherry Cir
- 3853 Level Grove Rd
- 3471 Level Grove Rd
- 3471 Level Grove Rd
- 3925 Level Grove Rd
- 3407 Level Grove Rd
Your Personal Tour Guide
Ask me questions while you tour the home.