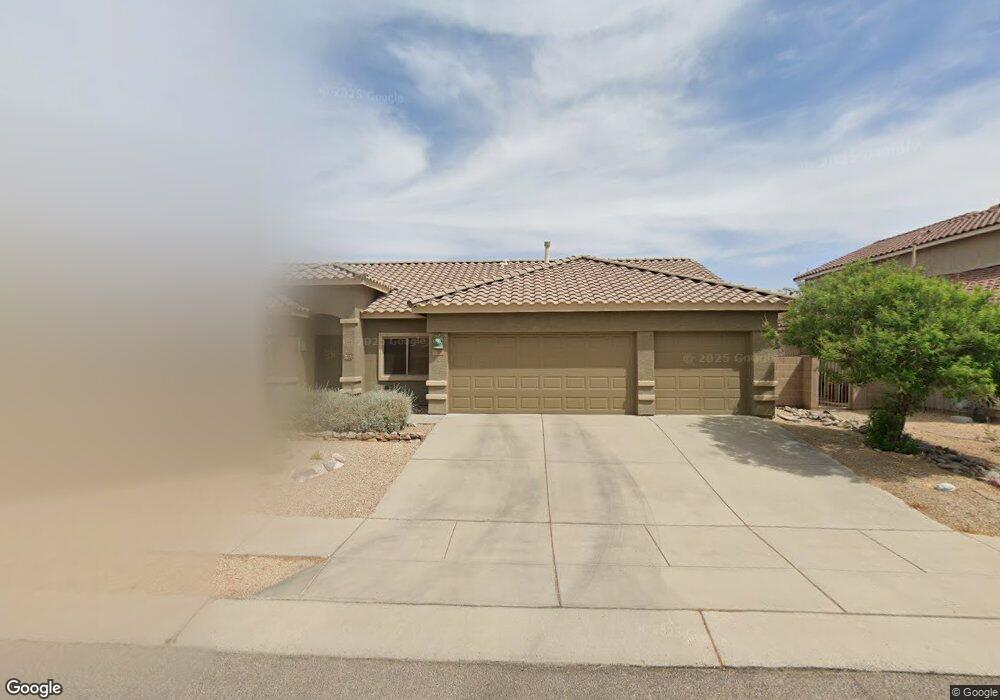
3691 E Fjord Pony Rd Tucson, AZ 85739
Estimated Value: $411,204 - $426,000
--
Bed
2
Baths
2,198
Sq Ft
$190/Sq Ft
Est. Value
About This Home
This home is located at 3691 E Fjord Pony Rd, Tucson, AZ 85739 and is currently estimated at $418,051, approximately $190 per square foot. 3691 E Fjord Pony Rd is a home located in Pima County with nearby schools including Coronado K-8 School and Ironwood Ridge High School.
Ownership History
Date
Name
Owned For
Owner Type
Purchase Details
Closed on
Sep 28, 2006
Sold by
Johnson Cyril C
Bought by
Rydberg Kevin S
Current Estimated Value
Home Financials for this Owner
Home Financials are based on the most recent Mortgage that was taken out on this home.
Original Mortgage
$215,000
Outstanding Balance
$128,790
Interest Rate
6.53%
Mortgage Type
New Conventional
Estimated Equity
$289,261
Purchase Details
Closed on
Sep 30, 2005
Sold by
Johnson Cyril C and Johnson Theresa A
Bought by
Johnson Cyril C
Purchase Details
Closed on
Jun 9, 2004
Sold by
Fidelity National Title Agency Inc
Bought by
Johnson Cyrill C and Johnson Theresa A
Home Financials for this Owner
Home Financials are based on the most recent Mortgage that was taken out on this home.
Original Mortgage
$168,550
Interest Rate
6.29%
Mortgage Type
New Conventional
Create a Home Valuation Report for This Property
The Home Valuation Report is an in-depth analysis detailing your home's value as well as a comparison with similar homes in the area
Home Values in the Area
Average Home Value in this Area
Purchase History
| Date | Buyer | Sale Price | Title Company |
|---|---|---|---|
| Rydberg Kevin S | $275,000 | Longt | |
| Johnson Cyril C | -- | -- | |
| Johnson Cyrill C | $210,690 | Fidelity National Title | |
| Johnson Cyrill C | $210,690 | Fidelity National Title |
Source: Public Records
Mortgage History
| Date | Status | Borrower | Loan Amount |
|---|---|---|---|
| Open | Rydberg Kevin S | $215,000 | |
| Previous Owner | Johnson Cyrill C | $168,550 | |
| Closed | Johnson Cyrill C | $31,600 | |
| Closed | Rydberg Kevin S | $20,000 |
Source: Public Records
Tax History Compared to Growth
Tax History
| Year | Tax Paid | Tax Assessment Tax Assessment Total Assessment is a certain percentage of the fair market value that is determined by local assessors to be the total taxable value of land and additions on the property. | Land | Improvement |
|---|---|---|---|---|
| 2025 | $3,050 | $25,110 | -- | -- |
| 2024 | $3,050 | $23,915 | -- | -- |
| 2023 | $2,808 | $22,776 | $0 | $0 |
| 2022 | $2,808 | $21,691 | $0 | $0 |
| 2021 | $2,752 | $19,675 | $0 | $0 |
| 2020 | $2,715 | $19,675 | $0 | $0 |
| 2019 | $2,625 | $21,142 | $0 | $0 |
| 2018 | $2,490 | $16,996 | $0 | $0 |
| 2017 | $2,430 | $16,996 | $0 | $0 |
| 2016 | $2,235 | $16,186 | $0 | $0 |
| 2015 | $2,208 | $15,416 | $0 | $0 |
Source: Public Records
Map
Nearby Homes
- 3647 E Mecate Rd
- 15032 N Twin Lakes Dr
- 15011 N Gangarebo Place
- 3631 E Foxtrotter Rd
- 3526 E Farrier Dr
- 3554 E Canter Rd
- 15181 N Triple Crown Place
- 15150 N Gangarebo Place
- 15181 N Canter Place
- 15232 N Primrose Peak Trail
- 3574 E Violet Ridge Rd
- 15238 N Primrose Peak Trail
- 3562 E Violet Ridge Rd
- 14587 N Twin Lakes Dr
- Plan 1865 at Wildflower Reserve
- Plan 1465 Modeled at Wildflower Reserve
- Plan 1620 at Wildflower Reserve
- Plan 1383 at Wildflower Reserve
- Plan 1745 Modeled at Wildflower Reserve
- Plan 1262 at Wildflower Reserve
- 3703 E Fjord Pony Rd
- 3679 E Fjord Pony Rd
- 14912 N Twin Lakes Dr
- 3703 E Capriole Place
- 3715 E Fjord Pony Rd
- 3690 E Fjord Pony Rd
- 14924 N Twin Lakes Dr
- 3702 E Fjord Pony Rd
- 3714 E Fjord Pony Rd
- 3727 E Fjord Pony Rd
- 14936 N Twin Lakes Dr
- 3653 E Fjord Pony Rd
- 3709 E Capriole Place
- 0 E Fjord Pony Rd Unit 3569 20833054
- 3662 E Fjord Pony Rd
- 3726 E Fjord Pony Rd
- 14948 N Twin Lakes Dr
- 14913 N Twin Lakes Dr
- 3715 E Capriole Place
- 3739 E Fjord Pony Rd